|
|

Title Tab of the Chart Properties |

|

|

|
||
Title Tab of the Chart Properties |
|
|
|

|
|
|
Title Tab of the Chart Properties |
|
|
|
||
Title Tab of the Chart Properties |
|
|
|
|
|
|
||
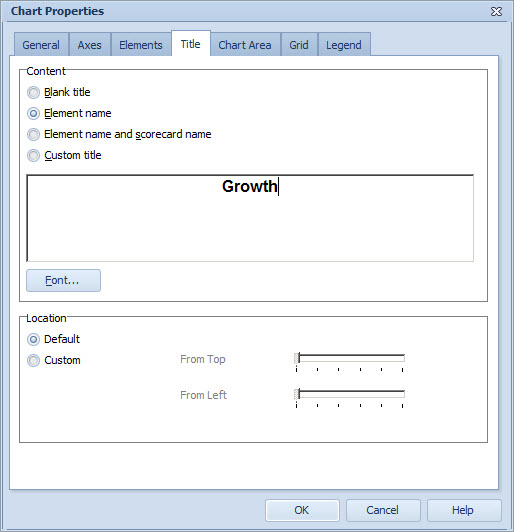
In the title tab, you can assign a title for your chart. To specify title and its properties, do the following:
| 1. | Select the type of the title from the options available in the Content section. If you select "Blank title", the title is removed from the chart. "Element name" uses the name of the element. "Element name and scorecard name" displays the name of the element followed by the name of its parent scorecard in parenthesis. The "Custom title" option allows you to type in the title freely. |
| 2. | In the case you selected Custom title, enter the text of the title in the text box. Note that only the chart title type is saved into a layout template, i.e. custom title text is used only in the current chart, not in a template. |
| 3. | To define the title font properties, click Font... button to display the Font Window. Then select the desired font, font style, font size, effect, script, and color, and click OK. The Font window closes. |
| 4. | To define where the title is positioned in relation to the graph, choose one of the options in the Location section. Choosing the Default location will place the title above the graph. Choosing the Custom location will enable the sliders that can be used to control the positioning of the title on the graph. |
See Also
General Tab of the Chart Properties
General Tab of the Chart Properties (Pie Chart)
General Tab of the Chart Properties (Radar Chart)
General Tab of the Chart Properties (Heat Map Chart)
Axes Tab of the Chart Properties
Elements Tab of the Chart Properties
Chart Area Tab of the Chart Properties
Grid Tab of the Chart Properties