|
|

Custom Tags |

|

|

|
||
Custom Tags |
|
|
|

|
|
|
Custom Tags |
|
|
|
||
Custom Tags |
|
|
|
|
|
|
||
Using custom tags gives you more freedom for inserting tags in the document. You can insert a custom tag using Insert Custom Tag button, which opens the Insert Custom Tag pane as shown below.
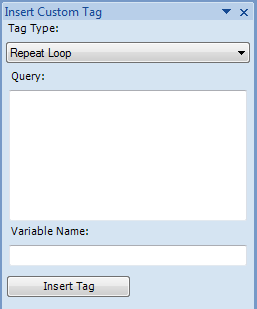
First select the type of the tag using the Tag Type drop-down box. This choice affects the other choices available.
Select Field as tag type in order to place a single field into the document. Type in the FullID of the element in question to the Source field. In order to use a loop variable or a parameter, enclose the name of the variable/parameter in brackets or select the variable/parameter from the drop-down list. For more information about FullID’s, please consult QPR – Developer’s Guide.
In Field name, type in the name of the field you wish to insert. All properties available through QPR Web Services Foundation for the object in question can be used, not only those that are normally available through QPR Add-In for Microsoft Office.
Using Repeat Loop as a tag type you can create a custom loop. See section "Loops with custom query" for more information.
For Graph tag type you need to enter the FullID or the variable/parameter name of the object in question to the Source field, or select the variable/parameter from the drop-down list. Then, choose Graph Type from the corresponding drop-down box. To have the graph use a specific graph template or a view setting, define the the Name or the FullID of the graph template or the view setting in the Template/View Settings field or select a variable/parameter from the drop-down list. You can define a Series symbol or leave it undefined, in which case the default series is used. The Period can be defined by giving a Name, a FullID of the period, a variable/period selected from the Id drop-down list, or a Date. The Name and the FullID define the period unambiguously. In case a Date is given for an element type graph (i.e. an Element Graph, a Range Icon, or a Trend Icon), the graph uses the period that contains the selected Date, and the period is chosen according to the period level of the element. In case a Date is given for a scorecard type graph (i.e. a Strategy Map, Scorecard View, or even a Flow Chart that contains scorecard links), the graph uses the period that contains the selected Date, and the period is chosen according to the period level of the top element. If the top element doesn't have a period level defined, the "largest" period level (which most often is Year) is used.
Selecting Table as tag type requires you to provide the FullID (or variable/parameter name) of the object in the Source field (or to select the variable/parameter from the drop-down menu) and then to select the type of the table. Each table type requires some additional parameters. See the subsections of the Tables section for more information.
For Value tag type, type in the FullID of the element in question to the Source field. In order to use a loop variable or a parameter, enclose the name of the variable/parameter in brackets or select the variable from the drop-down list. Then, enter the Series symbol, and select a Period either by entering the Id (or variable/parameter name) of the period or by selecting a variable/parameter from the drop-down menu, the Name or symbol of the special period, or a Date. If you want the Value tag to show the unit with the value, check the Show unit check box.