|
|

Elements Tab of the Chart Properties |

|

|

|
||
Elements Tab of the Chart Properties |
|
|
|

|
|
|
Elements Tab of the Chart Properties |
|
|
|
||
Elements Tab of the Chart Properties |
|
|
|
|
|
|
||
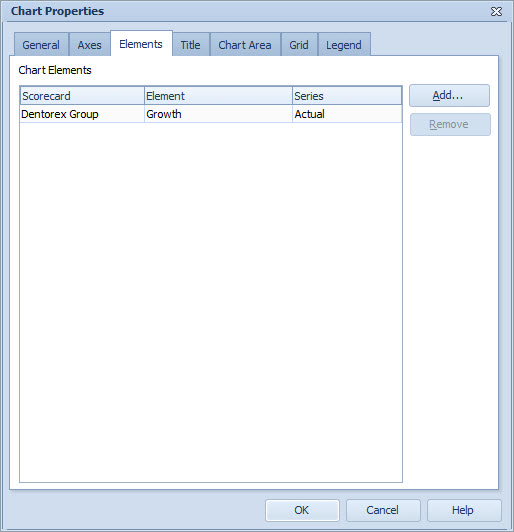
The Elements tab shows all the elements and series visible in the chart. Those consist of the element's own visible series, or series added through the benchmarking functionality. In addition to this, the chart may contain other elements/series that you can freely choose from the model.
The information of the chosen elements is stored to the element's own chart settings, not to the template, so making changes to these does not affect other charts using the same template.
To add elements to the chart:
1.Click the Add... button. The Select Elements window will open.
2.In the Select Elements window, select the element(s) you want to add to the chart and click OK. You can add multiple elements simultaneously by holding down the Ctrl or Shift key and clicking the elements on the list.
3.To specify the series (when possible), click the arrow in the Series column. If the series is not specified, the default series is used.
Note that the added elements use the settings of the chart's default series (defined in Value Settings Window.)
To remove elements from the chart:
1.Select the element you want to remove and click the Remove button. Note that some of the elements cannot be deleted. These are fixed items which come from the element itself through visibility settings (depending on what series have been selected to be shown on the chart) or from other elements through benchmarking settings.
References to additional elements are automatically updated if the series are deleted or the symbols are changed. If you add or remove elements from a chart, it does not affect other charts.
Note that the Elements tab is not available for Gantt Charts.
See Also
General Tab of the Chart Properties
General Tab of the Chart Properties (Pie Chart)
General Tab of the Chart Properties (Radar Chart)
General Tab of the Chart Properties (Heat Map Chart)
Axes Tab of the Chart Properties
Title Tab of the Chart Properties
Chart Area Tab of the Chart Properties
Grid Tab of the Chart Properties