|
|

General Tab of the Chart Properties (Pie Chart) |

|

|

|
||
General Tab of the Chart Properties (Pie Chart) |
|
|
|

|
|
|
General Tab of the Chart Properties (Pie Chart) |
|
|
|
||
General Tab of the Chart Properties (Pie Chart) |
|
|
|
|
|
|
||
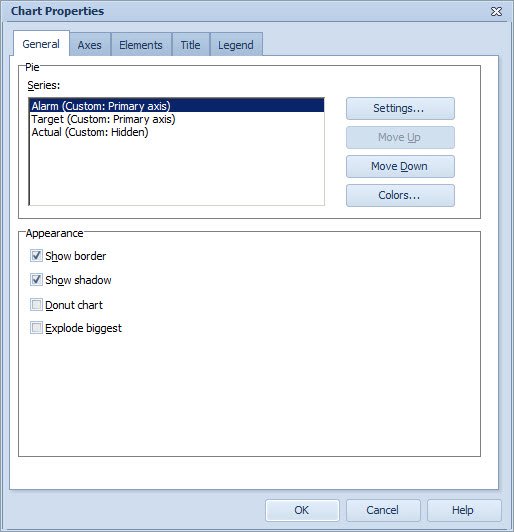
Pie Group
To configure the chart series for the Pie Chart:
1.Select the Series from the list.
2.To define the settings for the series, select Settings... The Series Settings Window opens. You can toggle the visibility of the series on the pie chart by right-clicking the desired series and selecting or unselecting Hide Series from the pop-up menu.
3.To sort the order of the series drawn in the chart, you can use the Move up and Move down buttons. To change the order, select the series and click either Move up or Move down. The first series in the list will be drawn first in the chart, and so on.
4.Click the Colors button to open the Color Scheme Window and define the colors to be shown on the pie chart
Appearance Group
Select the Show border check box to display borders between the slices.
Select the Show shadow check box to add shadow to the background of the chart.
Select the Donut chart check box to make the pie chart have a hole in the center.
Select the Explode biggest check box to to have the slice with the highest value to be separated from the pie chart.
See Also
General Tab of the Chart Properties Window
General Tab of the Chart Properties (Radar Chart)
General Tab of the Chart Properties (Heat Map Chart)
General Tab of the Chart Properties (Gantt Chart)
Axes Tab of the Chart Properties
Elements Tab of the Chart Properties
Title Tab of the Chart Properties