|
|

Grid Tab of the Chart Properties |

|

|

|
||
Grid Tab of the Chart Properties |
|
|
|

|
|
|
Grid Tab of the Chart Properties |
|
|
|
||
Grid Tab of the Chart Properties |
|
|
|
|
|
|
||
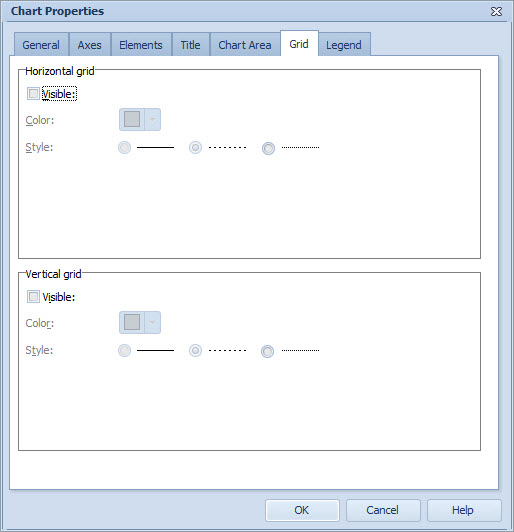
To define the horizontal and vertical grid lines for your chart, the following controllers are available:
| 1. | To show the horizontal grid, select the Visible check box. |
| 2. | To select a color for the horizontal grid, click the color box labeled as "Color" in the Horizontal grid group and select the color from the drop-down menu. |
| 3. | To select a style for the horizontal grid, select an option button. |
| 4. | To show the vertical grid, select the Visible check box. |
| 5. | To select a color for the vertical grid, click the color box labeled as "Color" in the Vertical grid group and select the color from the drop-down menu. |
| 6. | To select a style for the vertical grid, select an option button. |
In the case of Radar Charts, you can define these properties for the Circle grid and Radar grid in the same way as for the Horizontal grid and Vertical grid.
See Also
General Tab of the Chart Properties
General Tab of the Chart Properties (Pie Chart)
General Tab of the Chart Properties (Radar Chart)
General Tab of the Chart Properties (Heat Map Chart)
Axes Tab of the Chart Properties
Elements Tab of the Chart Properties
Title Tab of the Chart Properties
Chart Area Tab of the Chart Properties