|
|

Importing Data from an Excel Sheet with Mass Import |

|

|

|
||
Importing Data from an Excel Sheet with Mass Import |
|
|
|

|
|
|
Importing Data from an Excel Sheet with Mass Import |
|
|
|
||
Importing Data from an Excel Sheet with Mass Import |
|
|
|
|
|
|
||
![]() Exercise 139: Import Data from an Excel Sheet with Mass Import
Exercise 139: Import Data from an Excel Sheet with Mass Import
| 1. Create an Excel sheet as below and save it: |
id |
date |
act_value |
act_series |
tar_value |
tar_series |
ala_value |
ala_series |
sc_identifier |
MEA166 |
6.1.2008 |
20 |
act |
20 |
tar |
12 |
ala |
sc1 |
MEA166 |
8.2.2008 |
21,3 |
act |
20 |
tar |
12 |
ala |
sc1 |
MEA166 |
7.3.2008 |
21,1 |
act |
20 |
tar |
12 |
ala |
sc1 |
MEA166 |
1.4.2008 |
21,1 |
act |
20 |
tar |
12 |
ala |
sc1 |
MEA166 |
20.5.2008 |
20 |
act |
20 |
tar |
12 |
ala |
sc1 |
MEA166 |
15.6.2008 |
19,8 |
act |
21 |
tar |
12 |
ala |
sc1 |
MEA166 |
1.7.2008 |
19,8 |
act |
21 |
tar |
12 |
ala |
sc1 |
MEA166 |
5.8.2008 |
21 |
act |
21 |
tar |
12 |
ala |
sc1 |
MEA166 |
6.9.2008 |
21,3 |
act |
21 |
tar |
12 |
ala |
sc1 |
MEA161 |
6.1.2008 |
75 |
act |
78 |
tar |
70 |
ala |
sc1 |
MEA161 |
8.2.2008 |
75,1 |
act |
78 |
tar |
70,6 |
ala |
sc1 |
MEA161 |
13.3.2008 |
72,3 |
act |
78 |
tar |
65,8 |
ala |
sc1 |
MEA161 |
1.4.2008 |
71 |
act |
78 |
tar |
70 |
ala |
sc1 |
MEA161 |
4.5.2008 |
73,3 |
act |
80 |
tar |
71,1 |
ala |
sc1 |
MEA161 |
15.6.2008 |
74 |
act |
80 |
tar |
71,1 |
ala |
sc1 |
MEA161 |
1.7.2008 |
74,1 |
act |
80 |
tar |
72 |
ala |
sc1 |
MEA161 |
5.8.2008 |
73 |
act |
80 |
tar |
72 |
ala |
sc1 |
MEA161 |
6.9.2008 |
72,3 |
act |
80 |
tar |
69,9 |
ala |
sc1 |
| 2. In QPR Metrics client, create a new model based on the Balanced Scorecard Template: |
| 3. On the bottom of the Model Navigator frame, click the |
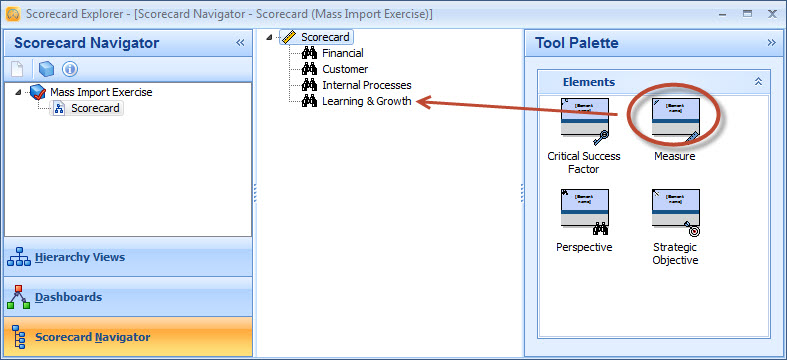
| 4. From the Tool Palette, drag two Measure elements under the Learning & Growth element in the Scorecard Navigator: |
| 5. In the Scorecard Navigator, double-click the Measure to open the Element Properties window. |
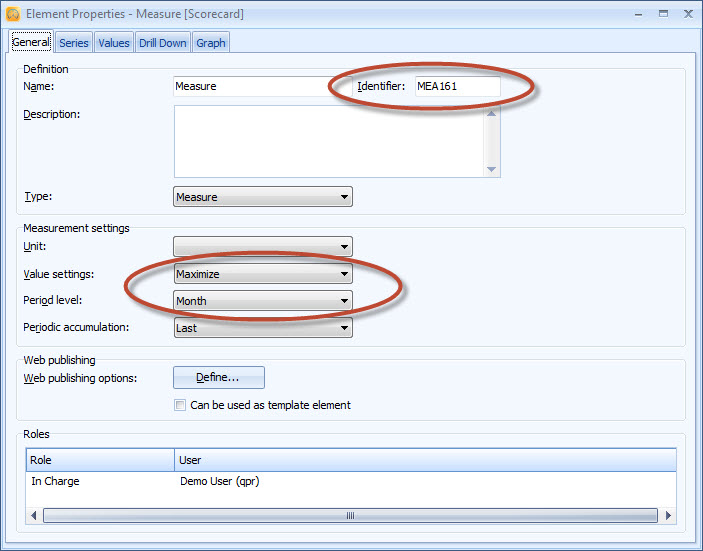
| 6. On the General tab of the Element Properties window, change the Identifier of the measure to "MEA161" (this matches the 'id' column in the Excel sheet), choose Maximize as the Value setting and Month as the Period level: |
| 7. Close the Element Properties window by clicking the |
| 8. Similarly, change the Identifier of the Measure(2) element to "MEA166", the Value setting to "Maximize" and the Period level to "Month". |
| 9. On the Model Navigator frame, double-click the Scorecard scorecard to open the Scorecard Properties window. |
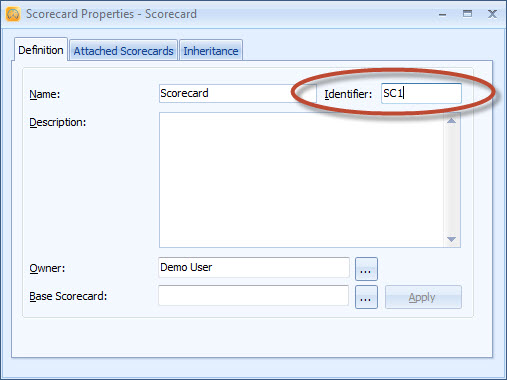
| 10. Change the Identifier of the scorecard to "SC1" (this matches the 'sc_identifier' column in the Excel sheet): |
| 11. Close the Scorecard Properties window by clicking the |
| 12. Next, we'll need to create an ODBC to the Excel sheet. If you are running a 32-bit version of Windows, from the Windows Taskbar, select Start -> Control Panel -> Administrative Tools -> Data Sources (ODBC). If you are running a 64-bit version of Windows, run the odbcad32.exe located at C:\Windows\SysWOW64. |
| 13. The ODBC Data Source Administrator window opens. Switch to the System DSN tab and click Add: |
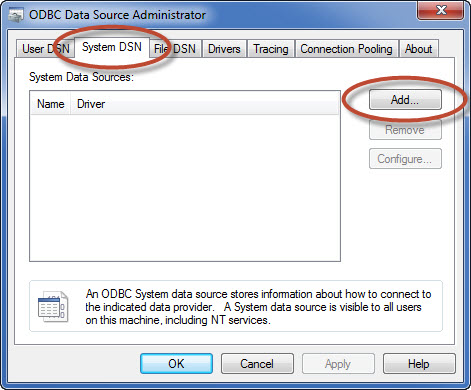
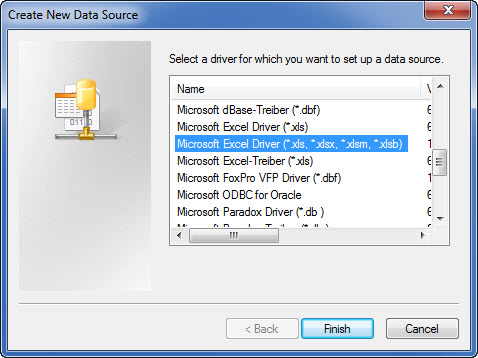
| 14. The Create New Data Source window opens. Select Microsoft Excel Driver and click Finish: |
| 15. The ODBC Microsoft Excel Setup window opens. Type in a name to the Data Source Name field, click the Select Workbook button, browse for the Excel sheet you created and click OK. |
| 16. Click OK to close the ODBC Microsoft Excel Setup. The System Data Source you created should now be listed in the Data Source Administrator window: |
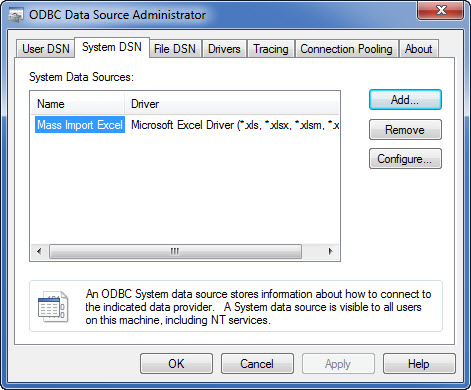
| 17. Click OK to close the ODBC Data Source Administrator window and return to the QPR Metrics client. |
| 18. On the View tab of the ribbon, click the |
| 19. The Integration View window opens. From the Views group, select SQL mass imports, and from the Commands group, select New: |
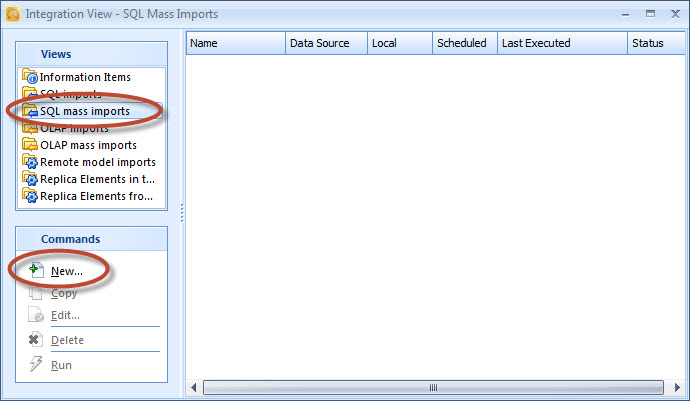
| 20. The SQL Mass Imports window opens. Select the Local data source checkbox, click the Connect button, select the ODBC we created and click OK: |
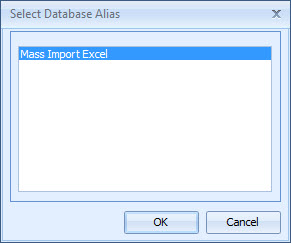
| 21. The Database Login window opens. Leave the Username and Password fields empty and click OK. |
| 22. Type in a name to the Task name field and write select * from "sheet1$" to the SQL query field: |
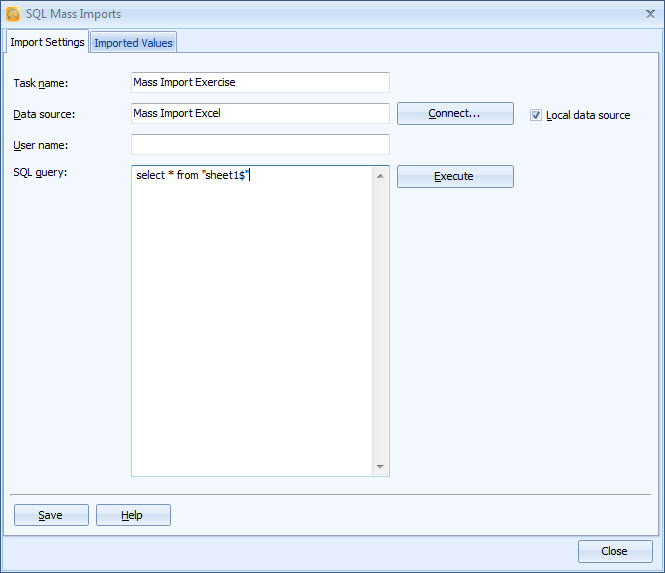
| 23. Click the Execute button. The values are imported from the Excel sheet. |
| 24. Next, we will save the values. This has to be done separately for the Actual, Target and Alarm values. First, we'll save the Actual values. From the drop-down menus in the Imported Values tab, select the following: |
Values in column: act_value
Periods in column: date
Scorecard: sc_identifier
Element: id
Series: act_series
| 25. Click Save. |
| 26. Now repeat steps 24 and 25 for the Target and Alarm values: |
Values in column: tar_value
Periods in column: date
Scorecard: sc_identifier
Element: id
Series: tar_series
Save
Values in column: ala_value
Periods in column: date
Scorecard: sc_identifier
Element: id
Series: ala_series
Save
| 27. Click Close and answer Yes to the "Save changes" question. |
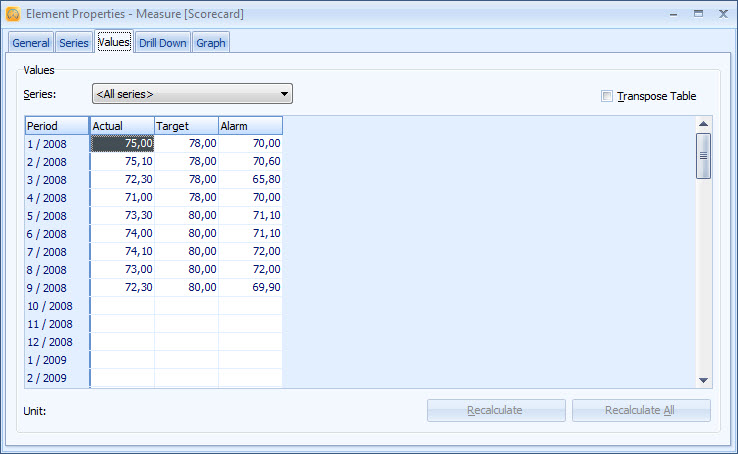
| 28. In the Scorecard Navigator frame, double-click the Measure element. |
| 29. The Element Properties window opens. Switch to the Values tab and scroll down to the periods from the year 2008. The imported values should be visible: |
 |
For more information, see the Integration View Window and SQL Mass Import topics in QPR Metrics - User's Guide.