|
|

Working Views |

|

|

|
||
Working Views |
|
|
|

|
|
|
Working Views |
|
|
|
||
Working Views |
|
|
|
|
|
|
||
QPR Modeling Client has four working views: the Diagram, the Navigator, the Analysis, and the Report View. The views can be opened by clicking the corresponding button in the Views group on the View tab of the ribbon.
Diagram View
The Diagram displays a graphical presentation of the model you are working with. With this view you can view and modify all parts of the model. Under the diagram is the Details Pane, that shows the properties of the selected element.
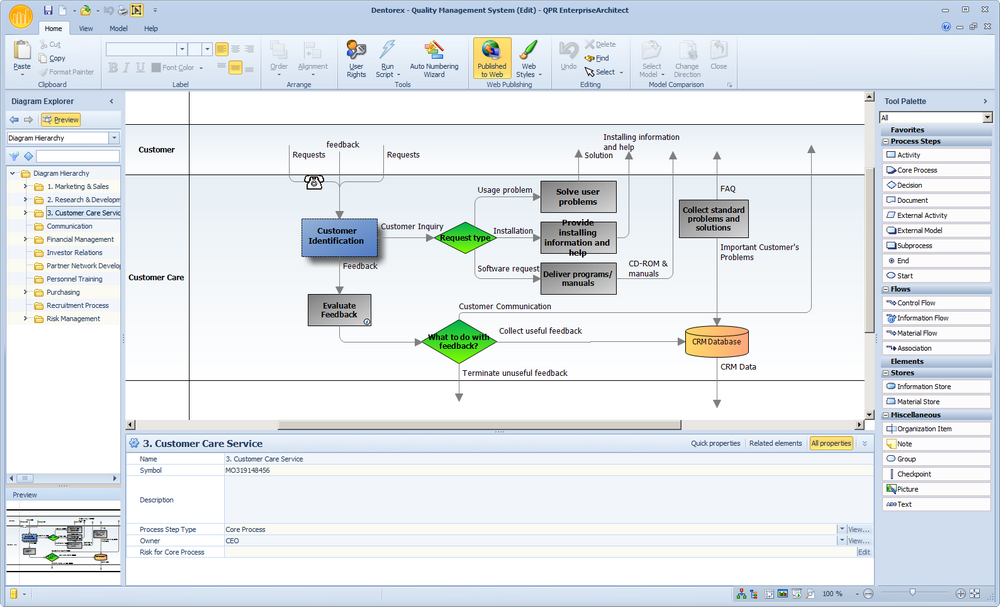
Diagram View
Navigator View
The Navigator is fundamental for quick and easy navigation between the various model elements of a process model. Elements are organized hierarchically so that information can be shown and hidden by expanding and collapsing the branches of the hierarchies. You can create and manage folder hierarchies using Navigator View Explorer.
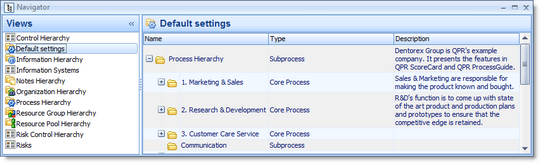
Navigator View
Analysis View
The Analysis view is used to input, modify and analyze measure values. A spreadsheet can be created on the basis of a selected measure to show its measure values in numerical format. Calculations such as greatest total and average sum can be calculated. Selected rows and/or columns on the spreadsheet can be shown as graphs. The current settings in the Analysis view can be saved for future use.
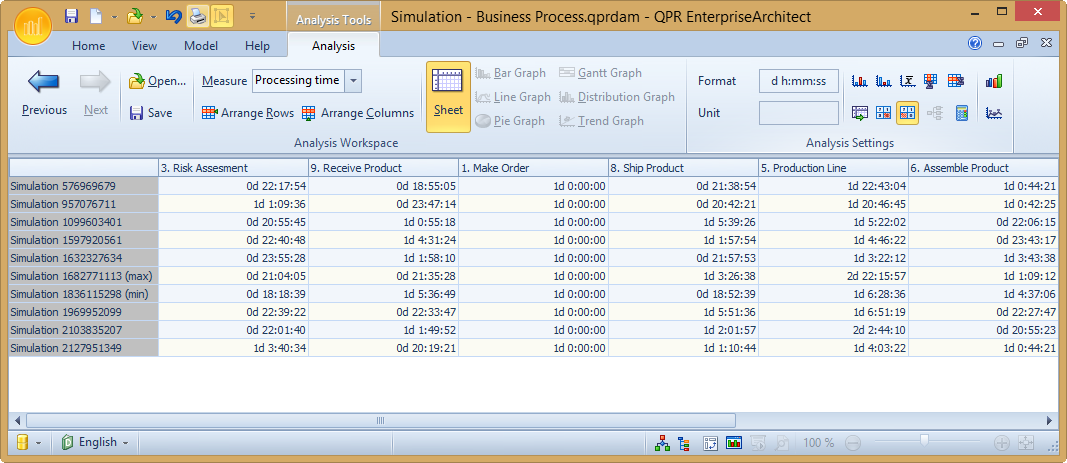
Analysis View
Report View
Reports show information about the current model in textual form. Information contents can be modified according to the user's wishes.
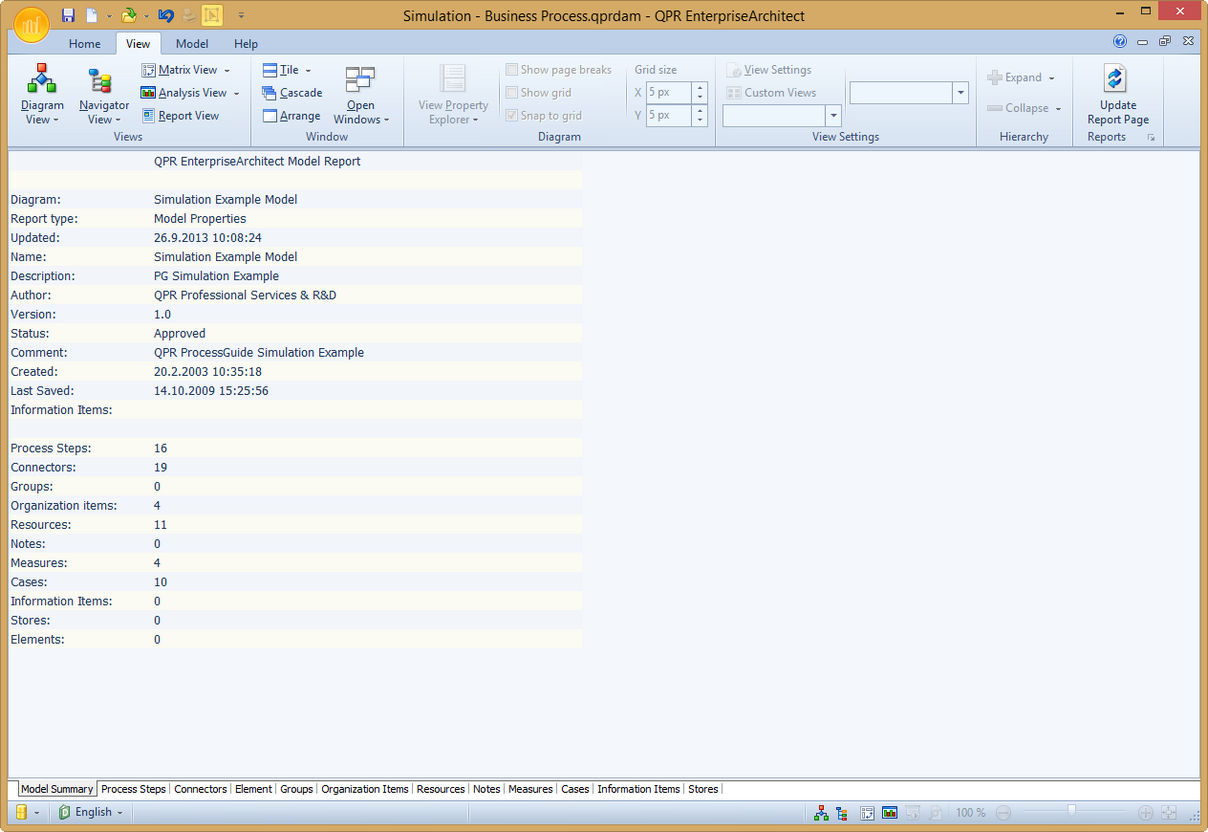
Report View