|
|

Hierarchy Views |

|

|

|
||
Hierarchy Views |
|
|
|

|
|
|
Hierarchy Views |
|
|
|
||
Hierarchy Views |
|
|
|
|
|
|
||
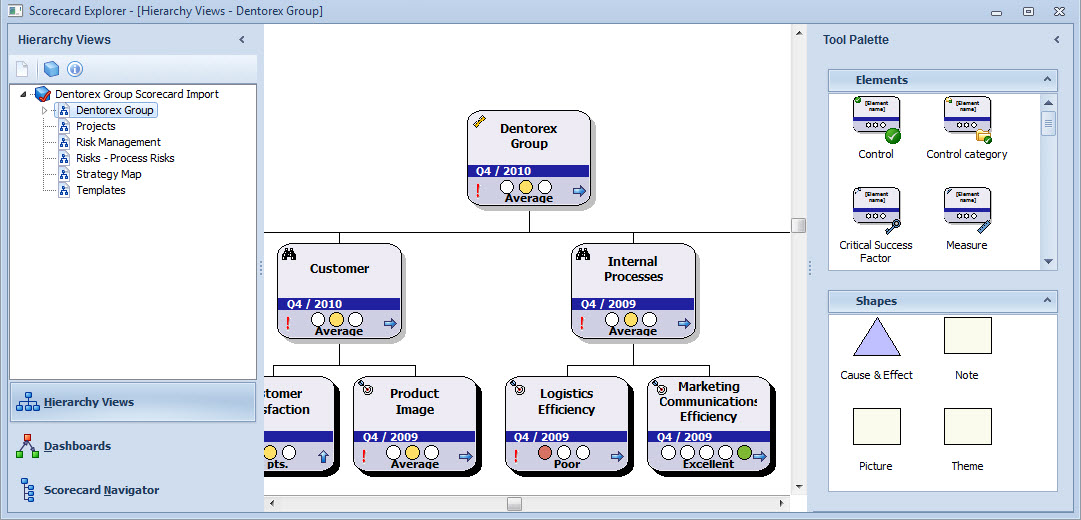
The Hierarchy Views with the related View menu in the Ribbon, is the optimal window for viewing and evaluating the scorecard and its elements. The primary use of the view is to let you to define and manage the elements that are used for monitoring the performance of a scorecard. It provides a clear overview of all the elements of the scorecard. It enables you to create, modify, delete, and link elements. It also allows you to link existing elements of other scorecards. This is a concrete way of cross-linking scorecards.
Another powerful use of the Hierarchy Views is to use them as a command post, from which you can easily access and modify any items belonging to the scorecard. From the Hierarchy view, you are only a couple of mouse-clicks away from details of any element, linked element, information item, or comment related to the scorecard. The Hierarchy view allows you to keep an eye on the big picture while you work on the details.
The Hierarchy View is a part of the Scorecard Explorer.
The View
The Hierarchy View provides a graphical representation of a scorecard with symbols depicting the elements of the scorecard. At the top of the hierarchy is the Top Element, which has the name of the scorecard. All the symbols below the top element represent elements. The element may be displayed on different horizontal levels to facilitate viewing, and a sub-element is displayed under its compilation element if subelements have not been hidden for the element (see Element Pop-up Menu of the Hierarchy Views section). However, you can see whether an element has hidden sublements or not by the color of the element's shadow: Elements with hidden sublements have a black shadow while elements without hidden subelements have a gray shadow.
Links are also displayed between symbols to give a clear picture of the information flow within the scorecard. The Hierarchy View always displays a link between a sub-element and its compilation element.
All these symbols can be created and arranged quickly using easy steps. This provides the shell of a scorecard, which can then be completed by opening other relevant windows.
In addition to the scrollbars and the zooming tools, you can use the mouse wheel to scroll and zoom the Hierarchy Views. Using the mouse wheel alone scrolls the view vertically, while using the mouse wheel with the Shift key pressed down scrolls the view horizontally. Hold down the Ctrl key and scroll up to zoom in or scroll down to zoom out. Note that you can use the zoom slider to control the zoom only between 10% and 200%, but you can use the Increase zoom level button and the mouse wheel to increase the zoom up to 400%. Clicking the Fit to Screen button ![]() show the whole model in the view.
show the whole model in the view.
To learn how to configure the Hierarchy Views, see Configuring the Hierarchy Views.
To learn how to work with the Hierarchy Views, see Working with Elements in the Hierarchy Views.
View Menu
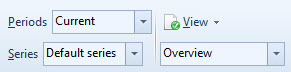
The View Menu in the View tab of the Ribbon is used with the Hierarchy Views in the following way:
|
Select a period for which the indicators will display the series. See Period Selector for more information. |
|
Select series for indicator shown below the element symbols. The default value is Default series. |
|
Open the View Menu. Available only for users with full rights to scorecards. |
|
Select the View. |
See Also