|
|

General Tab of the Series Settings Window |

|

|

|
||
General Tab of the Series Settings Window |
|
|
|

|
|
|
General Tab of the Series Settings Window |
|
|
|
||
General Tab of the Series Settings Window |
|
|
|
|
|
|
||
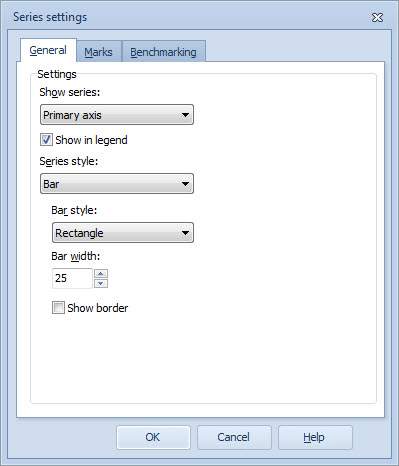
To define settings for the selected series:
From the Show series check box, select the axis in which the series is shown. Note that in the case there are more than one series using the same axis, the first series (the order depends on the order in the Series tab of the Element Properties window) is shown. You can also hide the series by selecting Hide series from the drop-down box. It is also possible to have the series use the Default visibility setting defined in the Series Properties window. In the case of Radar Charts, you can select only whether the series are shown or hidden. Check the "Show in legend" check box to have the series displayed in the legend box (in the case of Radar Charts or Heat Map Charts, this selection is not visible). Series visibility has no effect on Gantt charts.
From the Series style drop-down list you can define the series style. Depending on the chart type you can define the appearance of the series more precisely. Note that only the Point style is applicable to Radar Charts and Heat Map Charts.
Bar Series
You can select the bar width by using the arrow buttons, and you can define whether to show the border by selecting the check box. You can also select a bar style by selecting the appropriate option button: Rectangle, Gradient rectangle, or Pyramid.
Line Series
You can select the line width by using the arrow buttons (the value can be from 1 to 5), and you can define whether to show the border by selecting the check box. You can also define whether to use stairs by selecting the Stairs check box.
Point Series
You can select the point width and point height by using the arrow buttons. In the case of Radar Charts, you can select whether the points are visible or not with the Show points checkbox.
Stacked Series
This style is available for normal (i.e. not range limit) series only.
In the stacked bar chart the element values are displayed as an accumulation of series, so that each bar is a specified accumulation of three successive series.
You can select the bar width by using the arrow buttons, and you can define whether to show the border by selecting the check box. You can also select a bar style by selecting the appropriate option button: Rectangle, Gradient rectangle, or Pyramid.