|
|

Dashboards |

|

|

|
||
Dashboards |
|
|
|

|
|
|
Dashboards |
|
|
|
||
Dashboards |
|
|
|
|
|
|
||
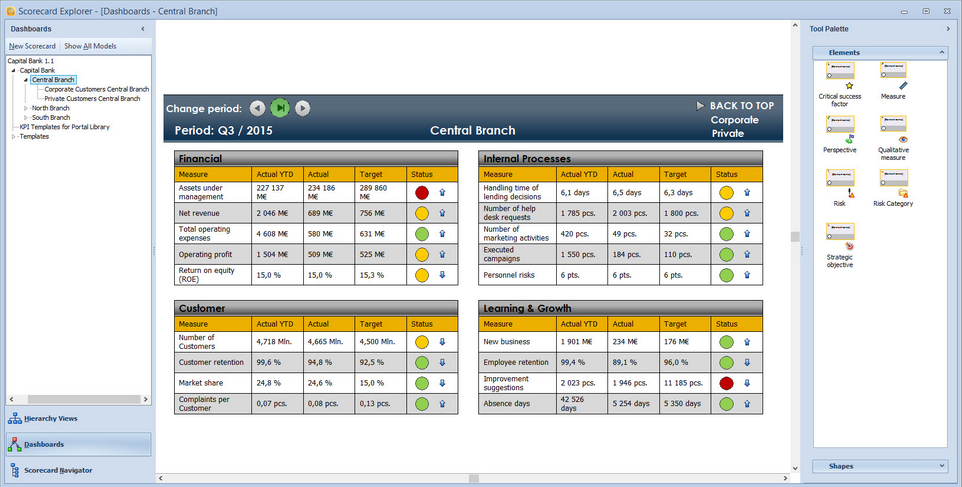
The Dashboards with the related View Menu in the Ribbon is a powerful tool which allows you to present measure information in the way you desire. In addition, you can map relationships between elements as well as calculate the correlation between the elements, based on the historical data. The Dashboards allow you to choose the time scale in which the correlation is calculated.
The Dashboards view is a part of the Scorecard Explorer.
The View
The Dashboards view provides a graphical representation of a scorecard with symbols depicting the elements of the scorecard as well as their interrelationships. You can separately define what elements are included from the scorecard in the Dashboard. See the Dashboards Pop-up Menu and Select Element Type window sections for more information about elements that can be included. Elements can also be created in the dashboards and only view instances instead of full elements can be added to the dashboards, too.
In addition to the scrollbars and the zooming tools, you can use the mouse wheel to scroll and zoom the Dashboards. Using the mouse wheel alone scrolls the view vertically, while using the mouse wheel with the Shift key pressed down scrolls the view horizontally. Hold down the Ctrl key and scroll up to zoom in or scroll down to zoom out. Note that you can use the zoom slider to control the zoom only between 10% and 200%, but you can use the Increase zoom level button and the mouse wheel to increase the zoom up to 400%. Clicking the Fit to Screen button ![]() show the whole model in the view.
show the whole model in the view.
To learn how to configure the Dashboards, see Configuring the Dashboards.
To learn how to work with the Dashboards, see Working with the Dashboards.
View Menu
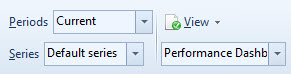
The View Menu in the View tab of the Ribbon are used with the Dashboards in the following way:
|
Select a period for which the indicators will display the series. See Period Selector for more information. |
|
Select series for indicator shown below the element symbols. The default value is Default series. |
|
Open the View Menu. Available only for users with full rights to scorecards. |
|
Select the View. |
|
Toggle the visibility of various element types included in the model. |
See Also