|
|

Working with Series |

|

|

|
||
Working with Series |
|
|
|

|
|
|
Working with Series |
|
|
|
||
Working with Series |
|
|
|
|
|
|
||
There are two different types of series: normal series and range limit series. The Normal series represents the actual value of the element. The range limit series define boundaries and are, what in the previous Scorecard versions were called, alarm values, target values and scales.
Adding a New Series
To add a new series:
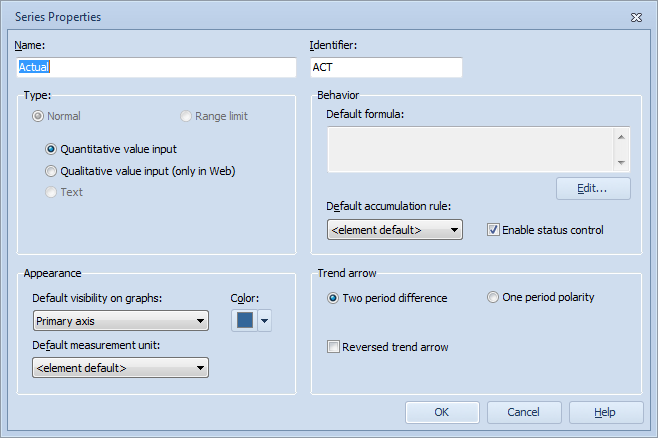
| 1. | In the Value settings window, select the value settings to which you want to add the series, and click Add series. The Series Properties window opens. |
| 2. | Type a name for the series in the Name field. |
| 3. | Type an identifier for the series in the Identifier field. |
| 4. | Select a type by clicking either Normal or Range limit. For the Normal type there are three additional options: Quantitative value input, Qualitative value input (only in Web) and Text. If quantitative value input is used, similar numerical values are used in both the QPR Metrics client and the QPR Portal. On the other hand, if qualitative value input is used, values can be input by selecting one range from a list of ranges in QPR Portal, while the QPR Metrics client will use the regular input method, if text value input is used, the series can be used to store text. However, text formatting, for example line breaks, are not possible. |
If you are using the qualitative value input, the measure will use the selected range's value as its value. See the example below to get a clearer picture of the functionality:
Example: Using the Qualitative Value Input
The management decides to measure customer satisfaction in a qualitative manner. A qualitative measure is defined into the scorecard. Ranges are Poor = 1, Satisfactory = 5, Good =10.
The person responsible for the measure is asked to provide the qualitative value for the measure each month. The person goes to Portal, opens the measure, and opens the value input table. He is then presented with a drop-down list box with the ranges as their options (Poor, Satisfactory, Good). He selects good (10 is stored in the database as the value for the measure)
A QPR Metrics administrator uses the QPR Metrics client to enter measure values. He opens the abovementioned qualitative measure and enters 7 as the actual value for the measure. The measure's alarm value is 2 and target value is 8, therefore the actual value belongs to the satisfactory range. Since the measure is defined to be a qualitative measure, web users see instead of the value seven a text saying 'Satisfactory'. |
| 5. | Click the Edit... button if you want to define a default formula for the series. |
| 6. | If you wish to enable status control for the series, check the Enable status control checkbox. |
7. To select a color for the series, click the Color button and select a color from the drop-down menu. The button color changes to the color you selected. This setting is not applicable to Text type series.
| 8. | Select the Default visibility on graphs setting for the series. This default visibility setting can be used on the General Tab of the Chart Properties. |
| 9. | Select the Default measurement unit for the series. The elements that use the series will then automatically use the selected default measurement unit for the series. |
| 10. | Select the Default accumulation rule for the series. The elements that use the series will then automatically use the selected default accumulation rules for the series. |
| A particular element series will use the Default measurement unit and Default accumulation rule settings in in this order: |
| 1. Setting configured for the element series itself, if not set to <default>. |
| 2. Setting configured for the series, if not set to <element default>. |
| 3. Setting configured for the element. |
| 11. | Select the desired trend arrow behavior. The "Two period difference" checks the difference of the period that is being calculated and the previous period. In the case the previous period has a smaller value than the period that is being calculated, the trend is rising and vice versa. The "One period polarity" option checks whether the period has a positive or a negative value and uses rising trend for positive values and a falling trend for negative values. |
| 12. | Select the "Reversed trend arrow" option to reverse the direction of the trend arrow. Reverse trend arrow is useful in cases where you want to monitor values the growth of which indicates negative trend. This setting is not applicable to Text type series. |
| 13. | Click OK. The new series is added to the list in the Value settings window. |
Editing a Series
To edit a series:
| 1. | Select the series you want to edit from the list in the Value settings window. |
| 2. | Click Edit. The Series Properties window opens. |
| 3. | Edit the settings you want and click OK. The new settings are saved to the database. |
Deleting a Series
To delete a series, select the series and click the Delete... button or press the Delete key.
Note! Deleting a series will delete all related values as well.
More about Value Settings.