|
|

Range Properties Window |

|

|

|
||
Range Properties Window |
|
|
|

|
|
|
Range Properties Window |
|
|
|
||
Range Properties Window |
|
|
|
|
|
|
||
By using the range limits, you can visualize and compare the values of your elements. The range limits can provide boundaries to the areas between range limits, which are called ranges. The value assigned to the range is helpful when comparing the elements. Since the elements may use different units, these range values help to provide a common unit by which the elements can be compared.
For example, if you have three ranges: Poor, Average, and Excellent, then they could be assigned the range values of 0, 5, and 10. These range values can be used in formulas to create a common unit for calculating the values of elements that use different units.
Adding a New Range
To add a new range:
| 1. | In the Value settings window, select the value settings to which you want to add a range. |
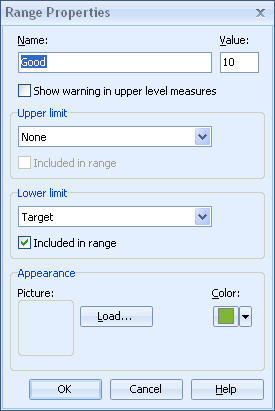
| 2. | Click the Add Range... button. The Range Properties window opens. |
 |
| 3. | Type a name for the range in the Name field. |
| 4. | Type a value for the range in the Value field. |
| 5. | You can instruct QPR Metrics to notify parent elements when element's value enters to this range. To do that, tick the Show Warning in Upper Level Measures box. |
| 6. | Select an upper limit for the range in the drop-down list box of series. You can also choose to not have an upper limit by selecting None. |
| 7. | To include the series in the range ( i.e. values that fall on the series value are considered to be in the range), select the Included in range check box. |
| 8. | Select an lower limit for the range in the drop-down list of series. You can also choose to not have an lower limit by selecting None. |
| 9. | To include the series in the range, select the Included in range check box. |
| 10. | To load a picture, click the Load... button and browse your computer for the bitmap image that you wish to use. This picture can be used as an indicator for an element symbol in the Hierarchy Views. Note that the maximum size for the image is 16*16 pixels. Any image with greater dimensions will be scaled down to ensure proper layout in the Hierarchy Views and the Dashboards. Supported image formats are BMP, PNG, GIF, and JPG. |
| 11. | To select a color for the range, click the Color box, select a color from the drop-down menu, and click OK. |
| 12. | When you have completed defining the range properties, click OK. The new range is added to the list in the Value Settings window. |
Editing a Range
To edit a range:
| 1. | Select the range you want to edit from the list in the Value settings window. |
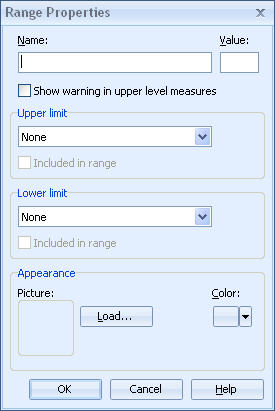
| 2. | Click the Edit....button The Range Properties window opens. |
|
| 3. | Edit the settings and click OK. The new settings are saved to the database. |
Note: When range limits have been modified, a recalculation must be performed in order for the changes to take affect on the measurement results.
There are no restrictions in entering values outside the given ranges.
To perform a recalculation, open the Options window (Application menu ![]() QPR Metrics Options), change to the Calculation tab, select the All periods option and click the Recalculate button.
QPR Metrics Options), change to the Calculation tab, select the All periods option and click the Recalculate button.
Deleting a Range
To delete a range, select the range and click the Delete button, or simply press the Delete key. A confirmation dialog will appear. Click Yes to confirm deletion.
See Also