|
|

Simulation Options Dialog |

|

|

|
||
Simulation Options Dialog |
|
|
|

|
|
|
Simulation Options Dialog |
|
|
|
||
Simulation Options Dialog |
|
|
|
|
|
|
||
The options for running simulations are available in the Simulation Options dialog. The Simulation Options dialog is shown every time a simulation is started. The Simulation options dialog has two pages: General and Reports. The simulation settings defined here are saved in the QPR_Clients.ini file for later use.
General page
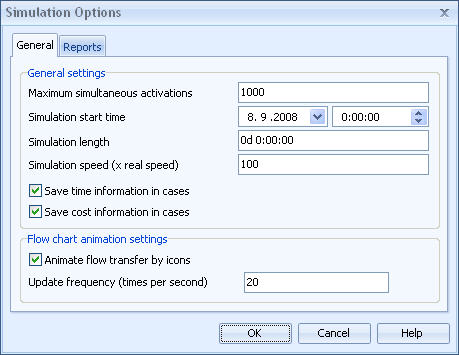
Simulation options dialog - General page
The General page shows information for simulation and animation. "Maximum simultaneous activations" sets the limit for number of activations active or suspended at any time. The purpose of this limit is to control abnormal situations where process simulation 'explodes', i.e. generates new activations infinitely. This happens usually due to mistakes made in modeling the process or if the process structure has many backward loops. "Simulation start time" sets the time when the simulation is to begin. "Simulation length" sets a time limit for the simulation run. When this limit has been reached the simulation is automatically stopped. "Simulation speed" sets the factor for speeding up the simulation compared to the real time. E.g. if simulation speed is 60 times normal speed, a process step which has a processing time of 1 minute will be simulated in 1 second. The lead time and cost information calculated during the simulation can be saved to cases for later analysis. Each activation that starts the simulation creates its own case. E.g. if the process is started 100 times during the simulation, cases named Case 1 to Case 100 will be generated.
The lower part of the page contains the options for the animation in the diagram. The progress of an activation of a process step is animated by a vertical line moving from left to right. If activations are waiting for resources, the number of these activations is shown in the bottom-left corner of the process step. The transfer type icons can be used in a same way to indicate the progress of flow transfers. Update frequency specifies how often the diagram will be updated, i.e. how smooth the simulation is. The update frequency must be set between 1 and 20.
Reports page
The Reports page is used to specify which reports will be created for analyzing the simulation. If a report is checked, it will be created. The filename and location for the report can be typed in or selected using the Browse button.