In this chapter, we will create a child measure table under each measure in the parent scorecard using nested loops and custom tags.
 Exercise 6: Create a Table by Repeating a Row.
 | 1. Open the designed report document that was created in the Loops topic. |
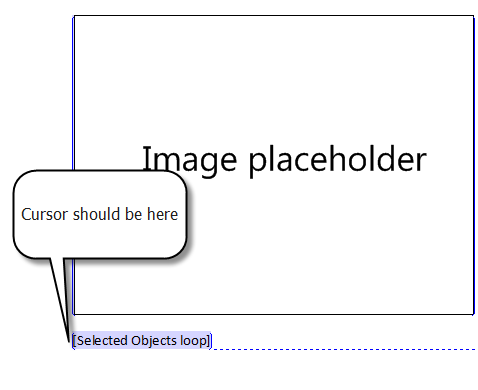
 | 2. Move the cursor between the 'Image placeholder' and '[Selected Objects loop]' tag holder and press Enter to insert a line break. |
 | 3. The cursor should now be under the 'Image placeholder' just before the '[Selected Objects loop]' tag holder: |

 | 4. On the QPR tab of the ribbon, click  Insert Custom Tag. The Insert Custom Tag pane opens. Insert Custom Tag. The Insert Custom Tag pane opens. |
 | 5. From the 'Tag Type' drop-down menu, select "Repeat Loop". |
 | 6. From the 'Loop Type' drop-down menu, select "Custom". |
 | 7. In the 'Query' field, type "[{object}].ChildObjects". (This query utilizes the QPR Web Services Foundation Metrics Object Function 'ChildObjects'. See the QPR - Developer's Guide for more information about the QPR Web Services Foundation functions.) |
 | 8. In the 'Sort Order' field, type "scorecard.name". |
 | 9. In the 'Variable Name' field, type "child". The pane should now look like in the picture below: |

 | 10. Click the Insert Tag button and close the Insert Custom Tag pane by clicking the  button in the top right corner of the pane. button in the top right corner of the pane. |
 | 11. Add a table containing one row and four columns between the tags you just inserted. |
 | 12. Move the cursor inside the first cell in the table: |

 | 13. On the QPR tab of the ribbon, click  Insert Field. The Insert Field pane opens. Insert Field. The Insert Field pane opens. |
 | 14. On the Insert Field pane, select "QPR Metrics Models" from the 'Search From' drop-down menu and expand the hierarchy by clicking the  button. button. |
 | 15. Select 'Add-In for Microsoft Office Training Model' from the list. |
 | 16. From the 'Search Only' drop-down menu, uncheck everything else but "Variables". |
 | 17. Click the Search button. |
 | 18. From the 'Search Results' section, select "child". |
 | 19. From the 'Fields Available' section, select "Name". |
 | 20. Click the Insert button. |
 | 21. Repeat steps 12 through 20 for each of the other cells, but instead of selecting "Name" select "Value", "Range Icon", and "Trend Icon" for each cell respectively from the 'Fields Available' section: |

 | 22. On the Home tab of the ribbon, click the  Show/Hide Control Characters button so that line breaks etc. can be seen clearly. Show/Hide Control Characters button so that line breaks etc. can be seen clearly. |
 | 23. Remove extra line breaks from the cells in the table. The table should now look as in the picture below: |

 | 24. Resize the cells in the table giving more space for names and less space for icons. |
 | 25. On the QPR tab of the ribbon, click  Publish and define a name and a location to the report. Notice how the the measures in each table have the same name. Therefore, in the following steps we'll add the names of the original scorecards to the measures' names. Publish and define a name and a location to the report. Notice how the the measures in each table have the same name. Therefore, in the following steps we'll add the names of the original scorecards to the measures' names. |
 | 26. Place the cursor in the first cell, next to the '[Property: Name]' tag holder. |
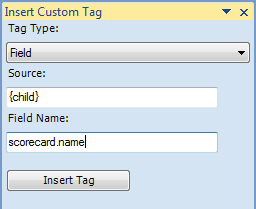
 | 27. On the QPR tab of the ribbon, click  Insert Custom Tag. The Insert Custom Tag pane opens. Insert Custom Tag. The Insert Custom Tag pane opens. |
 | 28. From the 'Tag Type' drop-down menu, select "Field". |
 | 29. In the 'Source' field, type "{child}". |
 | 30. In the 'Field Name' field, type "scorecard.name": |

 | 31. Click Insert Tag. |
 | 32. Add a space between the '[Property:Name]' and '[Property]' tag holders, and add parenthesis around the '[Property]' tag holder: |

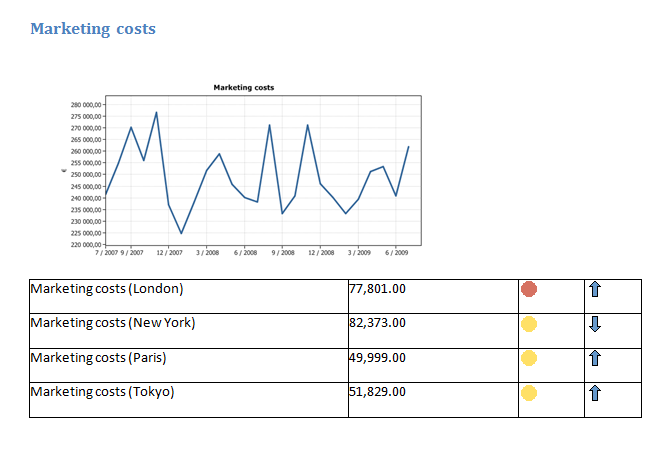
 | 33. On the QPR tab of the ribbon, click  Publish and define a name and a location to the report. The tables should now show the original scorecard's name next to the measure names: Publish and define a name and a location to the report. The tables should now show the original scorecard's name next to the measure names: |

For a complete example report, see the QPR Add-In for Microsoft Office Training Guide Complete Report.docx found in the <QPR package root>\Tutorials\QPR Add-In for Microsoft Office folder.
For more information, see the Loops and Custom Tags topics in QPR Add-In for Microsoft Office - User's Guide.
 Exercise 6: Create a Table by Repeating a Row.


 Insert Custom Tag. The Insert Custom Tag pane opens.


 button in the top right corner of the pane.


 Insert Field. The Insert Field pane opens.
 button.


 Show/Hide Control Characters button so that line breaks etc. can be seen clearly.


 Publish and define a name and a location to the report. Notice how the the measures in each table have the same name. Therefore, in the following steps we'll add the names of the original scorecards to the measures' names.

 Insert Custom Tag. The Insert Custom Tag pane opens.


 Publish and define a name and a location to the report. The tables should now show the original scorecard's name next to the measure names: