Exercise 108: Map Relationships Between Critical Success Factors and Strategies in the Mapping Exercise Model.
 | 1. Open the Mapping Exercise Model. |
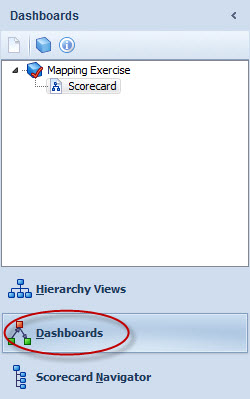
| 2. Open the Dashboards view by clicking on the Dashboards button on the bottom of the Model Navigator: |
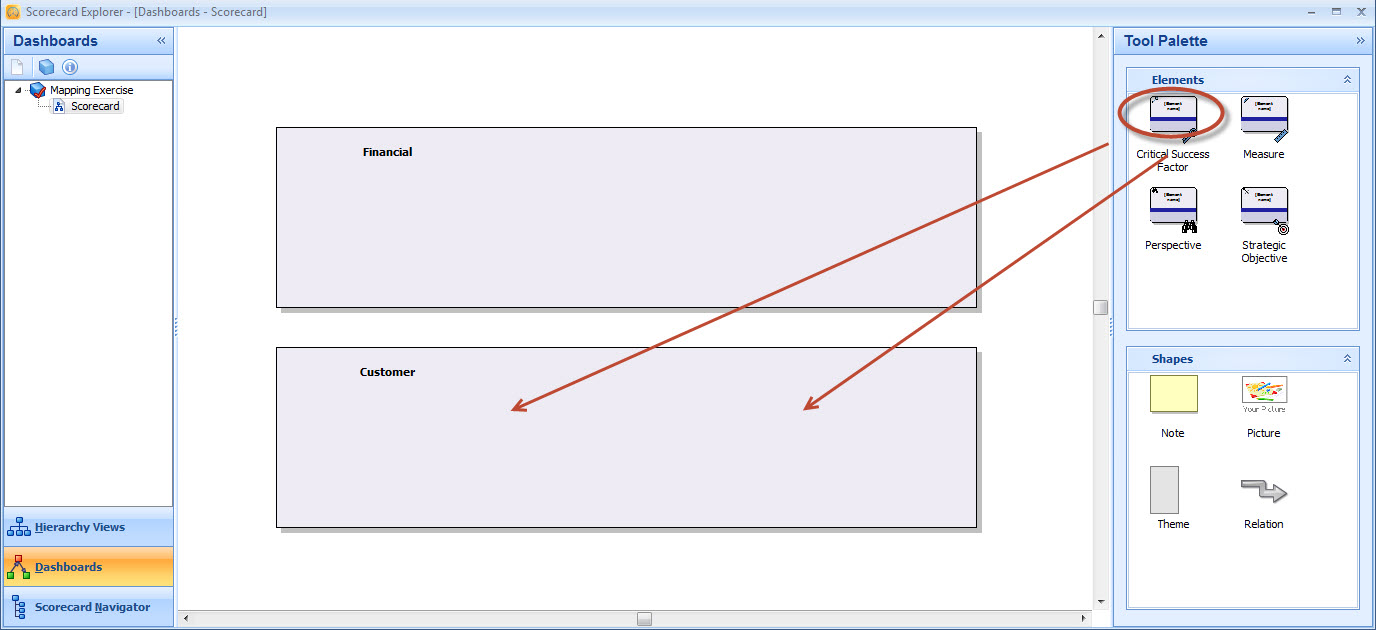
| 3. From the Tool Palette, drag two Critical Success Factors to the Customer perspective element: |
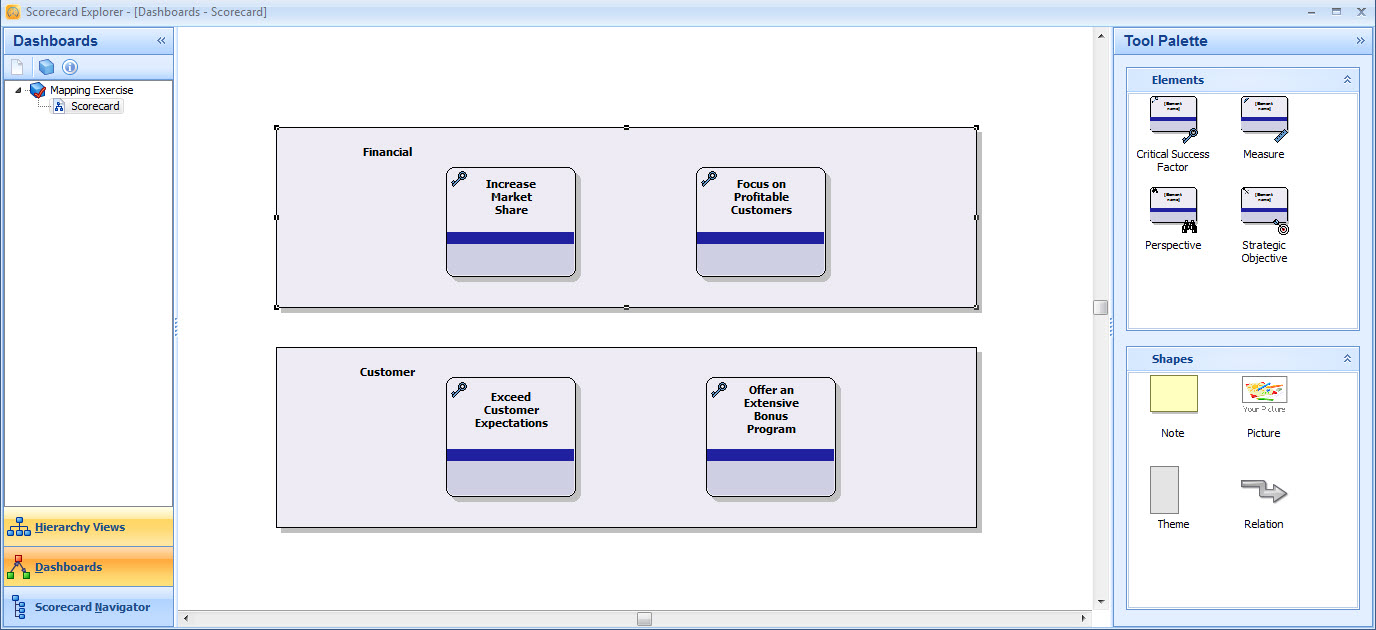
| 4. Select each Critical Success Factor and press F2 to rename them. Give them the names Exceed Customer Expectations and Offer an Extensive Bonus Program. |
| 5. Similarly as in steps 3. and 4., create two Critical Success Factors to the Financial perspective element and name them Increase Market Share and Focus on Profitable Customers: |
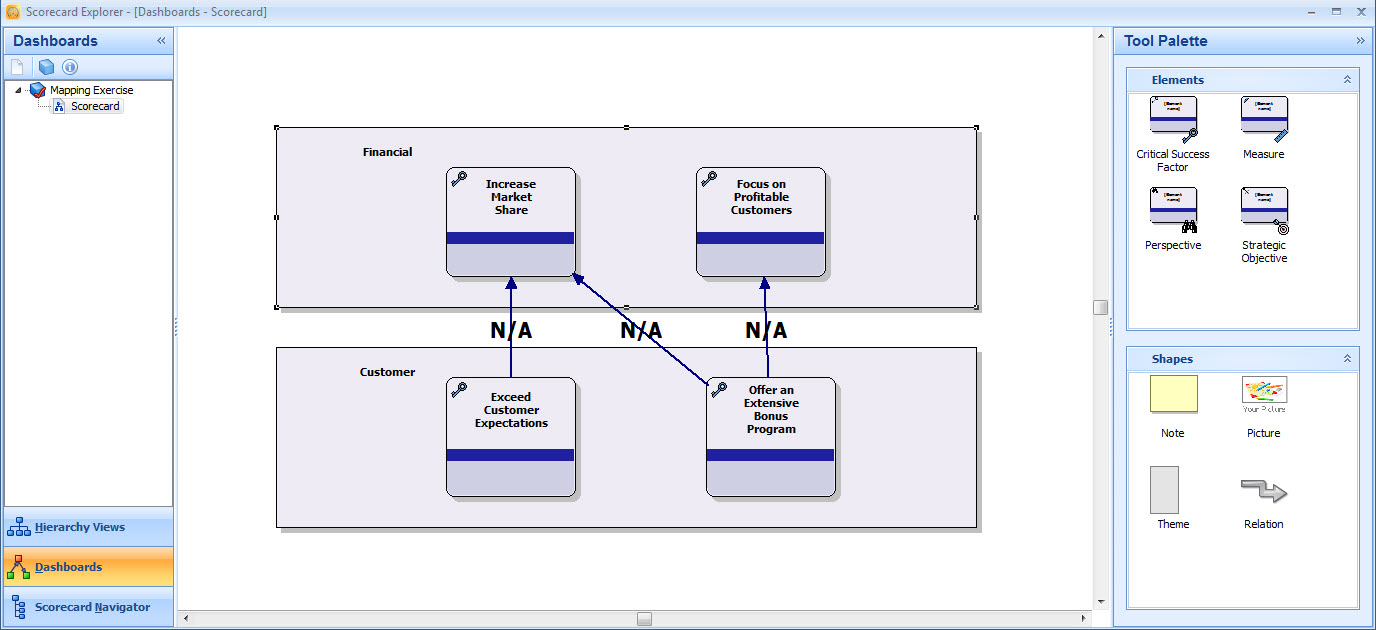
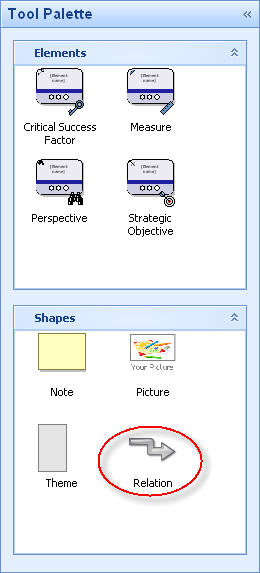
| 6. From the Tool Palette, select Relation from the Shapes section: |
| 7. Click the Exceed Customer Expectations element to set the starting point for the relation and then the Increase Market Share to set the ending point. |
| 8. Add a relation also between the Offer an Extensive Bonus Program and Increase Market Share elements and between the Offer an Extensive Bonus Program and Focus on Profitable Customers elements: |