In this chapter we will start to automate the creation of the second page of the hand built QPR Add-In for Microsoft Office Training Guide Hand Built Report.docx. For this we needs tags. Most tags needed in designing a report can be inserted by using the Insert Field pane.
 Exercise 4: Generate a Measure Page Containing the Name and Graph of the Measure 'Number of Individual Customer Feedbacks'.
 | 1. Create a new blank document. |
| 2. On the QPR tab of the ribbon, click  Insert Field. The Insert Field pane opens. Insert Field. The Insert Field pane opens. |
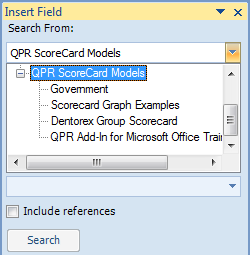
| 3. On the Insert Field pane, select "QPR Metrics Models" from the 'Search From' drop-down menu and expand the hierarchy by clicking the  button: button: |
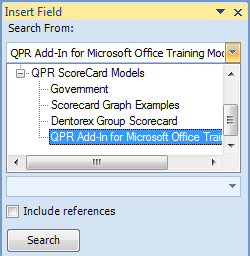
| 4. Select 'QPR Add-In for Microsoft Office Training Model' from the list: |
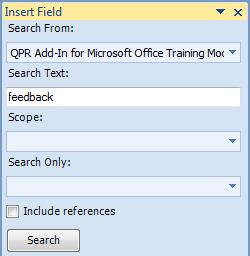
| 5. Type "feedback" in the 'Search Text' field: |
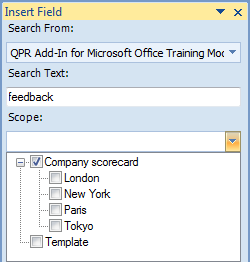
| 6. From the 'Scope' drop-down menu, expand the hierarchy by clicking the button, and uncheck everything else but 'Company scorecard': |
| 7. Make sure that the 'Include References' check box is unchecked. |
| 8. Click the Search button. |
| 9. From the 'Search Results', select "Number of individual feedbacks". |
| 10. In the 'Fields Available' section, check "Name" and "Element Graph": |
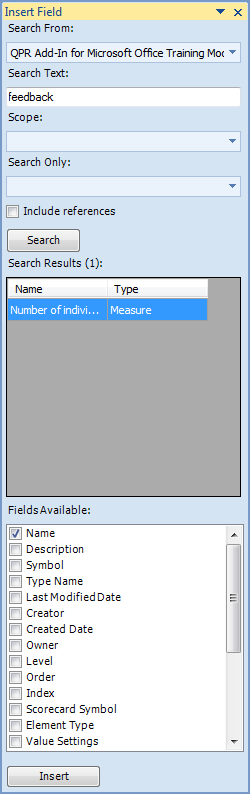
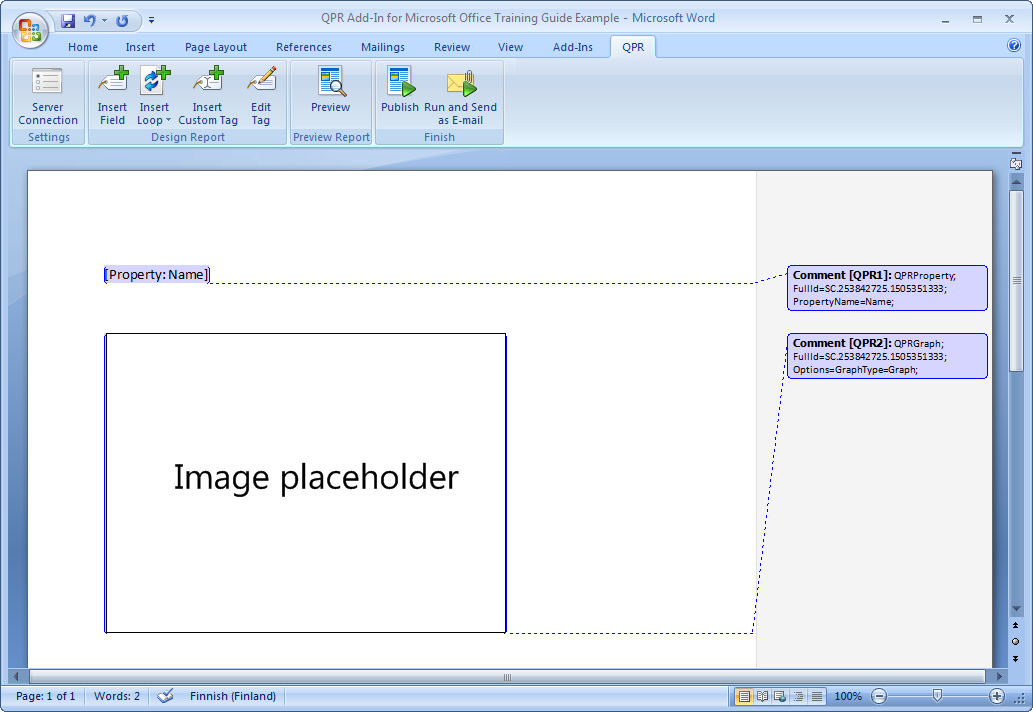
| 11. Click the Insert button. |
| 12. Close the Insert Field pane by clicking the  button in the top right corner of the pane. The document should now look like this: button in the top right corner of the pane. The document should now look like this: |
| 13. Save the document. It will be used later. |
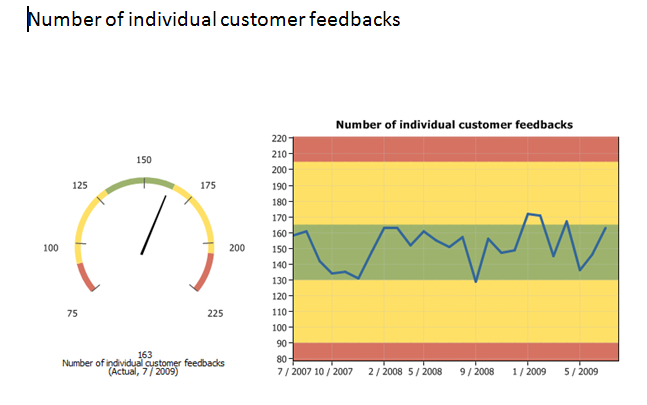
| 14. Click  Publish and define a name and a location to the report. The report is then created and it should look as in the picture below: Publish and define a name and a location to the report. The report is then created and it should look as in the picture below: |
For more information, see the Fields topic in QPR Add-In for Microsoft Office - User's Guide.