|
|

Simulation Graph |

|

|

|
||
Simulation Graph |
|
|
|

|
|
|
Simulation Graph |
|
|
|
||
Simulation Graph |
|
|
|
|
|
|
||
QPR Modeling Client provides the following simulation graphs for analysis purposes:
•Activation times graph shows activation (blue bars) and suspended times for process steps. Red color means that all inputs are available, but lack of resources suspends the activation and violet means that one activation of the element has been processed while another activation of it has been waiting for resources.
•Resource availability graph shows usage of each resource during simulation.
•Case lead times graph shows the lead time for each activation of the simulation, as well as average
The process runs 'optimally' if:
•There is only blue color in the first graph (i.e. all activations are processed as soon as possible).
•Resources are utilized effectively (i.e. resources are in use all/most of the time). However, to ensure short lead times, you may have to have some extra resources that will be unused at some parts of the process.
•Lead times (last graph) is as short as possible (or there are no "too long" lead times, resulting in cancelled orders, for example).
Of course in real life you cannot achieve all of these, meaning that you will have to prioritize the objectives and then try to find the optimal solution within the real-life constraints you have (it is not possible to add any additional machines, for example). After choosing the objectives that have the highest priority, modify the simulation properties accordingly and rerun the simulation. With this kind of fine-tuning you can find out how the process would run optimally without having to experiment with different possibilities in practice, thus saving time and resources.
Note: simulation graphs are available only directly after a simulation is run, i.e. they are not saved inside process model. Result data can be saved as measure cases for future usage, e.g. for analyzing.
Graphs of simulation results can be accessed by selecting Graphs from the Simulation group on the Model tab or on the Simulation tab of the ribbon. Selecting Graphs will also activate the Simulation tab of the ribbon. There are three types of graphs available:
![]() activation and waiting times
activation and waiting times
![]() resource availability
resource availability
![]() case lead times
case lead times
The Simulation Graphs group on the Simulation tab has the following buttons:
![]() Arrange Rows
Arrange Rows
![]() Activation times
Activation times
![]() Resource availability
Resource availability
![]() Case lead times
Case lead times
![]() Previous
Previous
![]() Next
Next
![]() Toggle 3D View
Toggle 3D View
![]() Toggle Values
Toggle Values
For the Activation and waiting times graph, the "Arrange Rows" button ![]() can be used to select the process steps, flows and groups shown as rows in the graph. This graph shows the activation times of each process step, flow or group as blue bars. The time spent on waiting for resources is shown as red bars. The violet color shows time when one activation of the process step, flow or group has been processed while another activation of it has been waiting for resources.
can be used to select the process steps, flows and groups shown as rows in the graph. This graph shows the activation times of each process step, flow or group as blue bars. The time spent on waiting for resources is shown as red bars. The violet color shows time when one activation of the process step, flow or group has been processed while another activation of it has been waiting for resources.
Resource availability graph shows when the resource has been used and when it has been free. The blue bar shows the amount of free resources during the simulation. The Previous ![]() and Next
and Next ![]() buttons can be used to browse the graphs for the selected resources. The "Arrange rows" button
buttons can be used to browse the graphs for the selected resources. The "Arrange rows" button ![]() can be used to select the resources to be shown in the graph.
can be used to select the resources to be shown in the graph.
Case lead times graph shows lead time for each case processed during the simulation. The bar at the bottom of the graph shows the average lead time for these cases.
For each graph the "Toggle 3D View" button ![]() can be used to switch between the 2D and the 3D mode. "Toggle Values" button
can be used to switch between the 2D and the 3D mode. "Toggle Values" button ![]() toggles the values on and off in the graph. The graphs can be zoomed by indicating the area to zoom in by dragging the mouse while holding the left mouse button down. The graph area can be also scrolled by holding down the right mouse button and dragging the area.
toggles the values on and off in the graph. The graphs can be zoomed by indicating the area to zoom in by dragging the mouse while holding the left mouse button down. The graph area can be also scrolled by holding down the right mouse button and dragging the area.
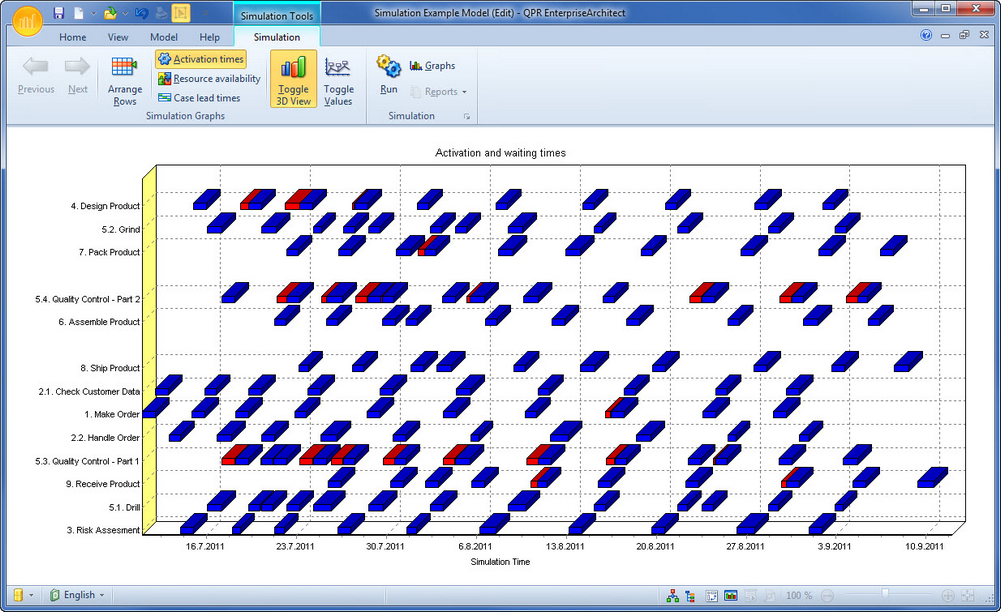
Example Simulation Graph