|
|

Calculate the Correlation Factor |

|

|

|
||
Calculate the Correlation Factor |
|
|
|

|
|
|
Calculate the Correlation Factor |
|
|
|
||
Calculate the Correlation Factor |
|
|
|
|
|
|
||
The correlation factor represents the effect of change between two measures. For correlation factor calculation to be statistically reasonable, there needs to be several (e.g. for every month within a year) values in both of the measures, and there needs to be variation in values. When there is no change in one of the measures (i.e. the values remain the same within the period of correlation calculation), the correlation co-efficiency cannot be calculated, as the effect of change is not applicable.
Calculating the Correlation Factor for a Relation
To evaluate the correctness of an assumed relation between two elements, you can calculate the actual correlation factor between two elements for the selected series and the timespan of your choice, based on historical data. Correlation cannot be calculated between two different period levels. You can calculate the correlation for any series or period of your choice.
In QPR Metrics, when calculating a correlation factor, the correlation period must be considered. The correlation period is a number of periods backwards from a defined period in the element where the correlation arrow starts from. For example, if you were calculating the correlation between customer retention and turnover, you would first have to decide the period of time from which you would take the data, backwards from the selected period.
A second consideration is the delay factor. Sometimes, there can be a correlation between two elements, but the correlation only occurs after a delay. Delay sets the delay in terms of periods (i.e. months, depending on the element settings), between the start and end element of the correlation. For instance, customer retention may correlate strongly with turnover, however, there might be a delay of a month before the changes in customer retention are felt in financial turnover.
Note: If the calculation period is greater than the elements have values or periods, the surplus periods are ignored and correlation is calculated. If there are missing values in the correlation period, the values are interpolated to obtain results from correlation calculations.
Once you decide upon a suitable correlation period or delay, QPR Metrics can automatically calculate the maximum correlation between the two elements. The maximum correlation is displayed. This feature is very useful for "proving" a correlation assumption and for testing other assumptions.
For a better understanding of the calculation of correlation factors, see Examples of Correlation Factor Calculations
To calculate the correlation factor:
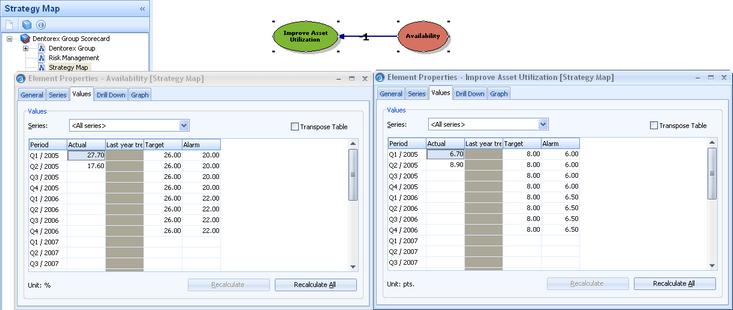
| 1. | Right-click the relation in the Dashboards. A pop-up menu opens. |
| 2. | Select the Correlation Parameters option. The Correlation Parameters window opens. |
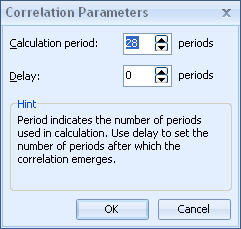 |
| 3. | Enter a calculation period or select a period by using the arrows. This setting defines how many periods are used in the calculation. |
| 4. | Enter a delay period or select a period by using the arrows. The delay defines how many periods of delay there are before the correlation emerges. The direction of the correlation arrow also affects the delay so that the period used in the target element (i.e. the element the arrow points at) is the period of the source element plus the value in the delay field. For example, if you have elements A and B using monthly periods, the correlation arrow points from A to B, and the delay is set to 4, the correlation is calculated for instance between the January period of element A and the May period of element B. |
| 5. | Click OK. |
More about the Dashboards.
Example correlation factor calculation