|
|

Configure Chart Period Window |

|

|

|
||
Configure Chart Period Window |
|
|
|

|
|
|
Configure Chart Period Window |
|
|
|
||
Configure Chart Period Window |
|
|
|
|
|
|
||
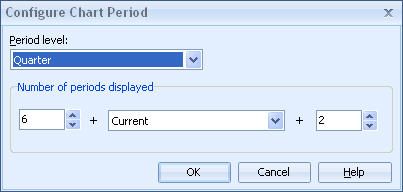
In the Configure Chart Period window you can configure the period level that is displayed as well as which periods get displayed in the chart. By selecting a flag period (the middle drop-down list with "Current" selected in the screenshot above) you do not need to reconfigure the periods displayed as time goes by.
For example if you set the "flag period" to be the "Current" period, with 5 periods displayed before the flag period and 0 periods displayed after the flag period, then the chart will display values for 6 periods in total. If the Current period is "Q2 2006" then, Q1 2005, Q2 2005, Q3 2005, Q4 2005, Q1 2006, and Q2 2006, would be the periods displayed in the chart. As a result, in the next quarter your chart will automatically display periods Q2 2005, Q3 2005, Q4 2005, Q1 2006, Q2 2006, and Q3 2006 since it knows that the "Current" period has changed to Q3 2006.
If you select "Latest (this element)" as the period in the middle drop-down list in the Number of periods displayed group, the latest period value for the element will be shown.
If you select "Latest (each element)" as the period in the middle drop-down list in the Number of periods displayed group, the latest period of each heat map element is used separately, instead of using the latest period of the current element. This means that, for heat maps, both benchmark elements and manually selected elements are taken into account, and that the current element uses the latest period of the element.
If you select "<None>" as the period in the middle drop-down list in the Number of periods displayed group, the chart in the element view in QPR Portal uses the period selected in QPR Portal. If this option is selected, the period locking has no effect.
To configure the period of the chart, do the following:
| 1. | From the Period level drop-down list, select the period level to be used for the chart. |
| 2. | From the Number of periods displayed group, select the flag period from the drop-down list box. |
| 3. | Set the number of periods to be displayed before the flag period next. Adjust the value on the left side of the flag period with the up and down arrows or enter a value into the field. |
| 4. | Set the number of periods to be displayed after the flag period. Adjust the value on the right side of the flag period with the up and down arrows or enter a value into the field. |
| 5. | Click the OK button to save your chart period configuration. |
Note that replica elements always use the default period settings in the current model regardless of what is configured for the original element's chart. Because of this, changes to period configuration in charts may not be applied to replica elements.