|
|

Creating a Graph Template and Applying it to Measures |

|

|

|
||
Creating a Graph Template and Applying it to Measures |
|
|
|

|
|
|
Creating a Graph Template and Applying it to Measures |
|
|
|
||
Creating a Graph Template and Applying it to Measures |
|
|
|
|
|
|
||
Graph configuration can be saved as a template for later use.
![]() Exercise 107: Modify a Graph, Create a Graph Template, and Apply it to a Measure
Exercise 107: Modify a Graph, Create a Graph Template, and Apply it to a Measure
| 1. Open the Graph Template Exercise Model. |
| 2. Expand the Customer perspective tree completely by clicking the |
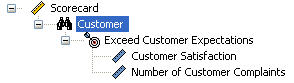
| 3. Double-click the Customer Satisfaction measure to open the Element Properties window. |
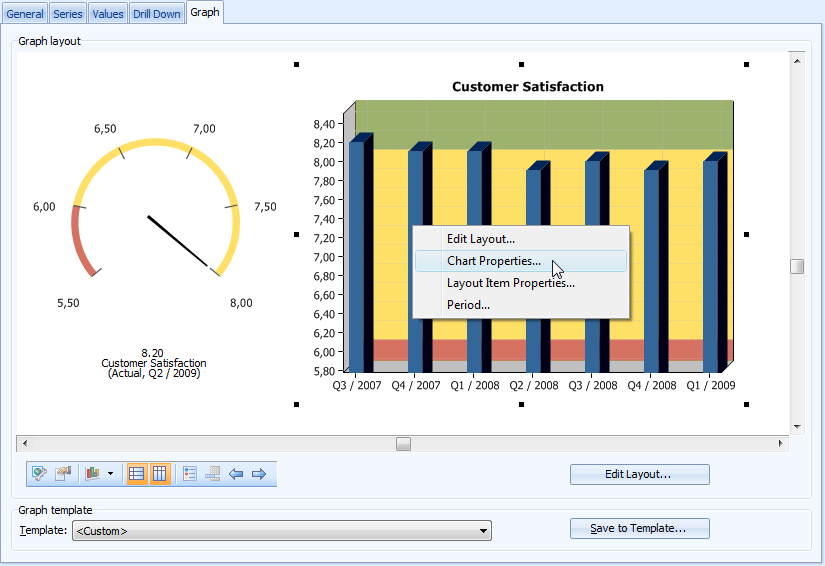
| 4. Switch to the Graph tab, right-click the chart and select Chart Properties from the pop-up menu: |
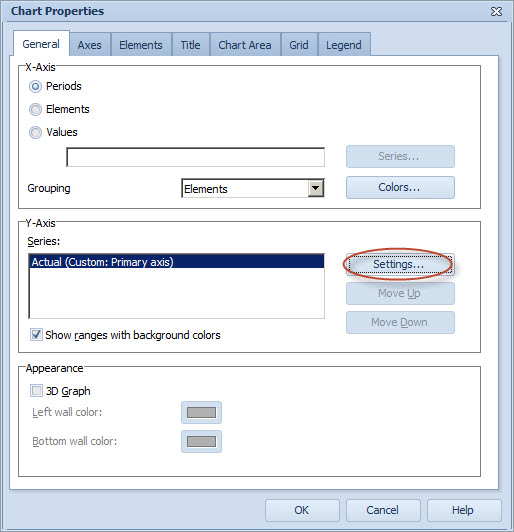
| 5. The Chart Properties window opens. From the Y-Axis group, select the Actual series and click Settings: |
| 6. The Series window will open. Switch to the Marks tab and select Show marks and Value: |
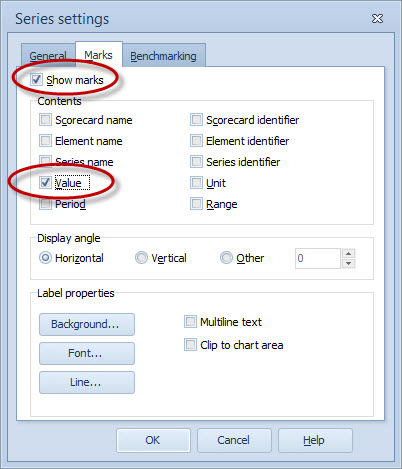
| 7. Click OK. The chart will now show the values for the Actual series. |
| 8. In the Chart Properties window, switch to the Legend tab and select Show legend and Show ranges: |
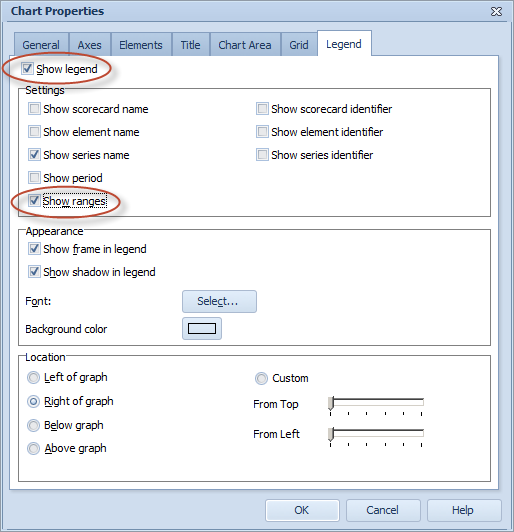
| 9. Click OK to close the Chart Properties window. |
| 10. In the Element Properties window, click Save to Template. |
| 11. Type in the name Graph Template Exercise and click OK. |
| 12. Close the Element Properties window by clicking the |
| 13. In the Scorecard Navigator, double-click the Number of Customer Complaints element to open its Element Properties window. |
| 14. Switch to the Graph tab and select the chart by clicking anywhere on it. |
| 15. Select Graph Template Exercise from the template drop-down menu: |
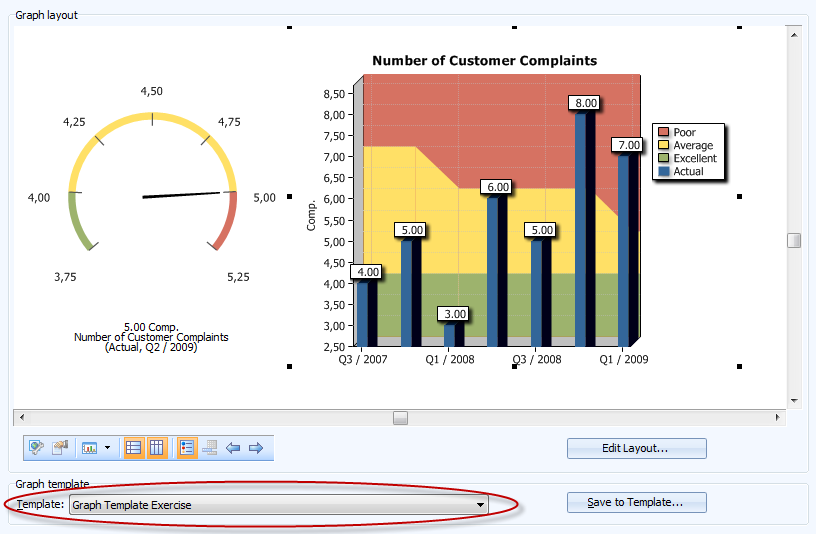
It would be cumbersome to apply the template to a number of elements each individually. That's why the template can be applied to several elements at once:
| 16. On the Model tab of the ribbon, click the |
| 17. Highlight the Graph Template Exercise on the list and click Apply To. |
| 18. Select All elements and click OK. The template is now applied to each element in the model. |
See the Graph Tab topic in QPR Metrics - User's Guide for more information.