|
|

Marks Tab of the Series Settings Window |

|

|

|
||
Marks Tab of the Series Settings Window |
|
|
|

|
|
|
Marks Tab of the Series Settings Window |
|
|
|
||
Marks Tab of the Series Settings Window |
|
|
|
|
|
|
||
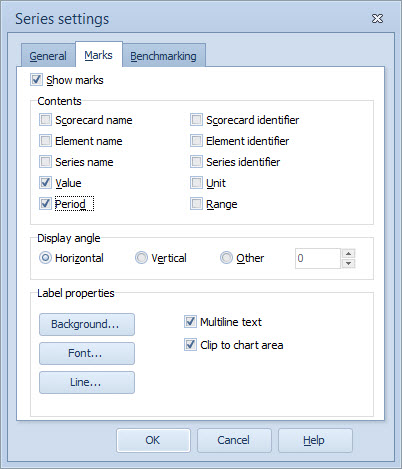
To include marks attached to the data points of a series, select the Show marks option.
Contents Group
To define the content for the marks, select whether to include the Scorecard name, Scorecard identifier, Element name, Element identifier, Series name, Series identifier, Unit, Value, Period, and/or Range in each mark. The Unit displayed is that which was defined in the General tab of the Element Properties Window.
Display Angle Group
To define the Display angle of the marks, select Horizontal, Vertical or Other angle. The angle is defined in degrees, 0 to 360.
Label Properties Group
•To change the background properties of the labels, click Background..., and define the background properties in the Label Background Properties window that opens.
•To define the mark text font properties click Font... The Font Window opens. Then select the desired font, font style, font size, effect, script, and color, and click OK.
•To change the label line properties, click Line..., and define the label line properties in the Label Line Properties window that opens.
•To display each of the selections on the Contents group on their own line, check the Multiline text check box.
•To have the marks clipped so that they don't go outside the chart area, check the Clip to chart area check box.
After you have selected the desired settings, click OK to apply the changes to the Chart's mark.
For Heat Map Charts, the recommended selections on the Marks Tab are:
•Contents: Element name
•Display angle: Horizontal
•Label properties: Transparent, Hide Line, and Distance: 5
For Pie Charts marks cannot be configured on a series level without affecting others. The latest change applied to marks on the series level is applied to every series displayed in the chart.
Note that the Marks tab is not available for Radar Charts.