|
|

Color Scheme Window |

|

|

|
||
Color Scheme Window |
|
|
|

|
|
|
Color Scheme Window |
|
|
|
||
Color Scheme Window |
|
|
|
|
|
|
||
You can define colors for different graphs on the horizontal axis to help distinguish the same series from different elements. The Color Scheme window is used to define the colors also for pie charts.
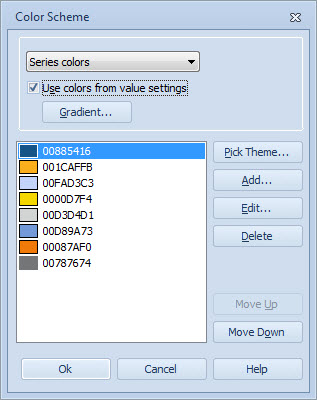
1.To define the color scheme used for the selected series or elements, select Colors... in the Chart Properties window.
2.If you want the colors defined for the series in Series Properties or for range in the Range Properties to be used for the current element series, select either Series colors or Range colors from the drop-down menu and select the "Use colors from value settings" option. If this option is unchecked, the colors defined in this Color Scheme window are used.
3.To add new colors to the color scheme, select Add... The Color Editor window opens. Alternatively, you can click the Pick Theme... button and select a color theme in the Pick Color Theme window.
4.To edit the colors used in the scheme, select the color and click Edit... The Color Editor window opens.
5.To delete a color from the scheme, select the color and click Delete.
6.You can modify the order of the colors with the Move up and Move down buttons. The order is then reflected on the graph so that the first color on the list is used for the first series, and so on.
Note that the Use colors from value settings option is not available for Heat Map Charts.