|
|

Chart Area Tab of the Chart Properties |

|

|

|
||
Chart Area Tab of the Chart Properties |
|
|
|

|
|
|
Chart Area Tab of the Chart Properties |
|
|
|
||
Chart Area Tab of the Chart Properties |
|
|
|
|
|
|
||
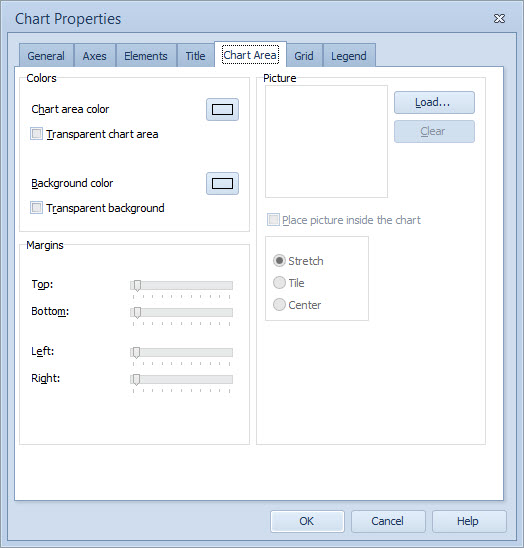
You can define the chart area color by clicking the Chart area color color box and selecting the color in the Color Editor window.
Chart's background color can be set by clicking the Background color color box and selecting the color in the Color Editor window.
If you do not want to use colored chart area and/or colored background (i.e. if you want to embed the chart into the background picture), select the Transparent chart area and/or Transparent background check boxes.
You can use the Margins sliders to adjust the chart space to have more space for example for the chart title or axis labels.
You can place a background picture into to Chart view to make it more vivid. To do that, click the Load button of the Picture group and a standard file dialog will open. Select the desired picture and click OK.
There are three rendering modes available: Stretch, Tile and Center. Stretch will reside the picture so that it covers the whole background, Tile will use multiple copies of the picture to fill the background area, and Center will just place the picture in the center of the background area. Click the corresponding radio button to select your favorite rendering.
If you want that the picture will appear only in the chart area and not in the whole viewing area, tick the Place picture inside the chart box.
Note: The background picture has to be in the Windows Bitmap format (BMP). In the case of Heat Map Chart, the Place picture inside the chart check box needs to be ticked and the Stretch rendering mode needs to be selected.
Note: In case of Radar Charts, the chart area properties cannot be modified.
See Also
General Tab of the Chart Properties
General Tab of the Chart Properties (Pie Chart)
General Tab of the Chart Properties (Radar Chart)
General Tab of the Chart Properties (Heat Map Chart)
Axes Tab of the Chart Properties
Elements Tab of the Chart Properties
Title Tab of the Chart Properties
Grid Tab of the Chart Properties