|
|

Legend Tab of the Chart Properties |

|

|

|
||
Legend Tab of the Chart Properties |
|
|
|

|
|
|
Legend Tab of the Chart Properties |
|
|
|
||
Legend Tab of the Chart Properties |
|
|
|
|
|
|
||
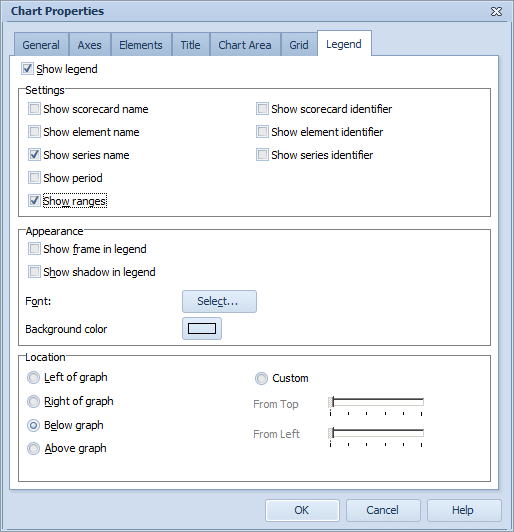
To specify the properties of the chart legend:
1.To display the legend, check the Show legend check box.
2.Select the items to be shown from the Settings group.
3.To use a frame around the legend, check the Show frame in legend check box.
4.To make the legend to cast a shadow, check the Show shadow in legend check box.
5.To define the legend text font properties, click Select.... The Font Window opens. Then select the desired font, font style, font size, effect, script, and color, and click OK. The Font window closes.
6.To specify a background color for the legend, click the color box labeled Background color. The Color Editor window opens.
7.To define where the legend is positioned in relation to the graph, choose one of the options in the Location section. Choosing the Custom location will enable the sliders that can be used to control the positioning of the legend on the graph.
Tip: To show or hide the chart legend in one step, simply click the Legend button, ![]() , located at the bottom bar of the Graph tab of the Element Properties Window.
, located at the bottom bar of the Graph tab of the Element Properties Window.
Note that the Show series name, Show series identifier, and Show ranges settings in the Settings group are not available for Heat Map Charts.
Note the the following restrictions for Radar Charts:
•When the Circle axis selection on the General tab is Periods, only the Show scorecard name, Show scorecard identifier, Show element name, Show element identifier, Show series name, Show series identifier, and Show ranges selections are available.
•When the Circle axis selection on the General tab is Series, only the Show scorecard identifier, Show element identifier, and Show series identifier selections are available.
See Also
General Tab of the Chart Properties
General Tab of the Chart Properties (Pie Chart)
General Tab of the Chart Properties (Radar Chart)
General Tab of the Chart Properties (Heat Map Chart)
Axes Tab of the Chart Properties
Elements Tab of the Chart Properties
Title Tab of the Chart Properties
Chart Area Tab of the Chart Properties